In the first of a three-part mini-series we are going to see how Power Query can help identify potential problems in our output tables. In part 1 we examine the importance of total checks and see how to construct them.
Introduction
I’ve been working on a Power Query project for a client recently. I’m not sure that the client realised it was going to be a Power Query project at the outset but, it turned out to be the best approach in order to achieve the required degree of automation and simplicity. Given the reliance on the accuracy and structural consistency of the underlying data, it was particularly important to build in appropriate checks to identify any issues.
From beginning to end
In these circumstances, it’s good to build in a check, or series of checks, that reconcile the total value or values in the file that you start with to your final output totals. Of course, this doesn’t prove that everything is correct, there could still be misallocations or compensating errors, but it does show if something is potentially wrong somewhere in the chain of operations between input and output.
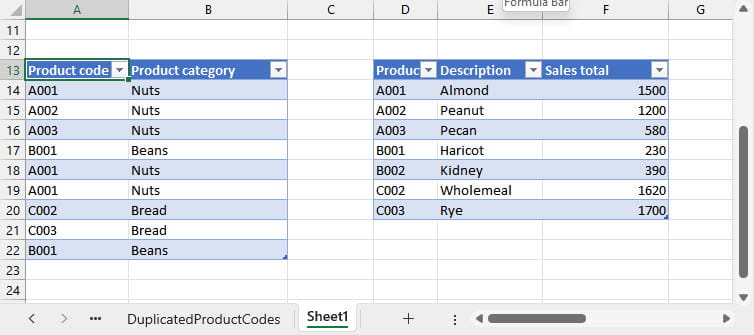
We will use a simple example of combining two files. We have the allocation of product codes to product categories in one file and total sales value by product in another. We want to use Power Query to merge the two files using the Product code as the key:

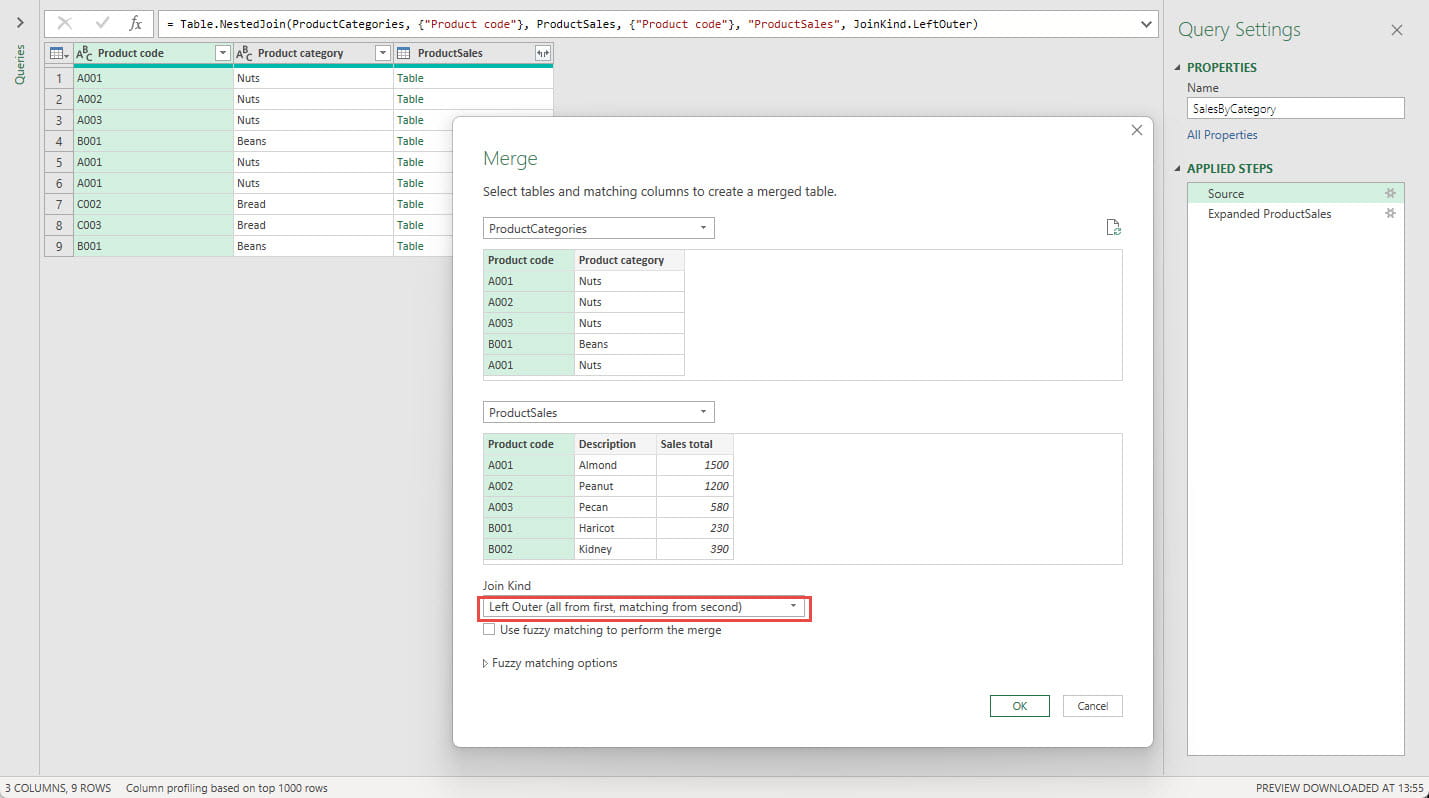
Our tables have been set up as Excel Tables so we can click on any cell in a Table to use the Data Ribbon tab, Get & Transform Data group, From Table/Range command to load each one into the Power Query editor. For now, we will just use the Close and Load To… command to load each query just as a Connection Only. We can then use the Get & Transform group, Get Data dropdown to choose Combine Queries, Merge:

We are aiming to produce an output table that adds our sales total to our product category table, so we have set the Join Kind to: Left Outer(all from first matching from second). This will include all of the rows in our ProductCategories table, whether or not there is a matching produce code in the ProductSales Table. We can expand our ProductSales Table column to create our output table and load it to our worksheet. For demonstration purposes, we will load the output table on to the same sheet as our original tables:

Given that our tables are very small, and both are visible in our worksheet, we can probably see that there are issues in our output table. Adding totals for our input values and our output values, quickly confirms that our sales by category table is not giving us the same values as our original table.
In this example, our input tables are both in the worksheet, but if they were external tables that we were just linking to, it might not be so straightforward to calculate the check total for our ProductSales input table. There are different ways to achieve this in the Power Query editor, but we will just use a simple method that only requires the use of commands in the editor interface. We want to turn our input table into a table with a single cell that holds the total value of the Sales total column. We also need the full table to use in subsequent steps in creating our output table. It’s easy enough in Power Query to create a query based on an existing query. We can just right-click on the existing query and choose Reference:

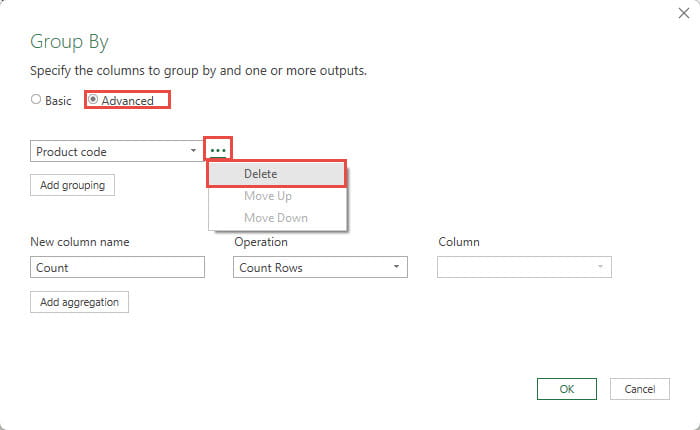
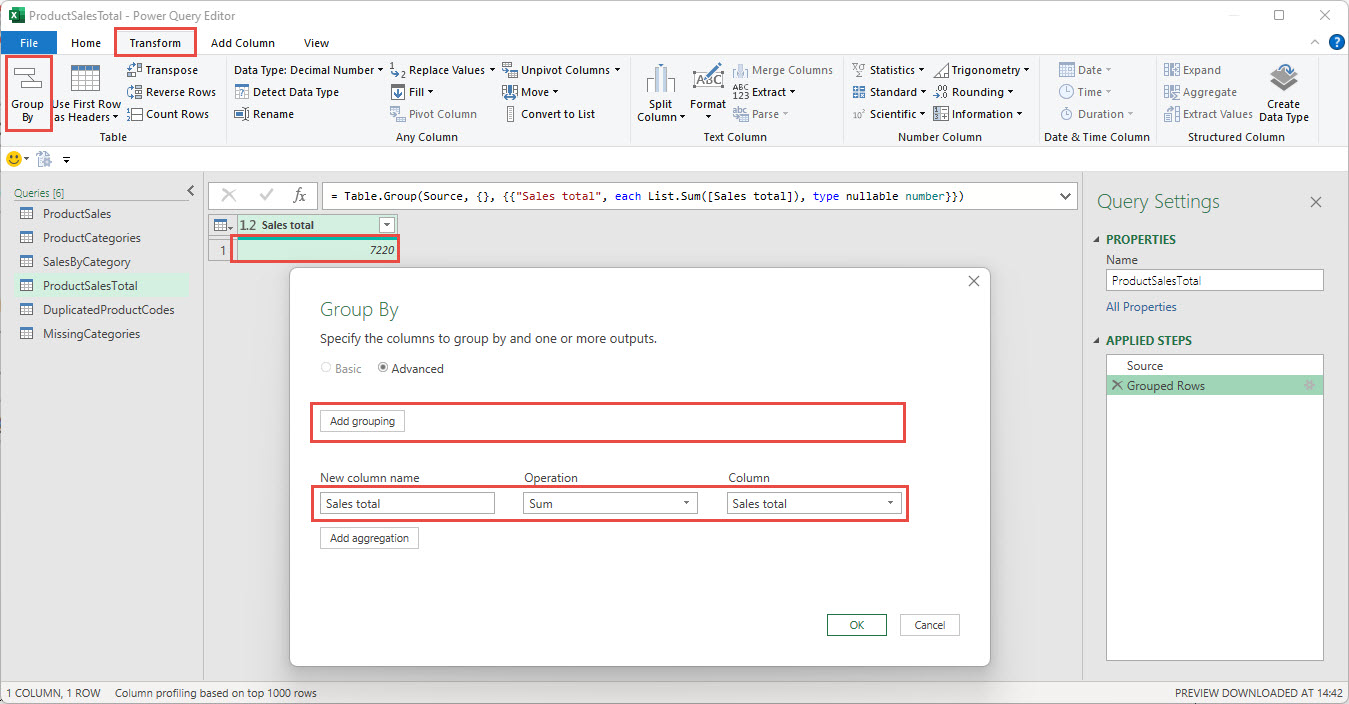
This creates a new query with a single Source step that just refers to the existing query. Any changes to that existing query will flow through into our new query. Now that we have preserved our original query, we can turn our new query into just the total calculation that we need. We will use the Transform Ribbon tab, Group command, but we don’t actually want to group our table by anything so will click on the Advanced option and use the … button to delete the default grouping:

We can then set up our aggregation to Sum our Sales Total column. This gives us a Table with a single row and single column, that just contains our total:

Next time
So far, we have seen how Power Query can help identify that we have a problem. Next time, we will look at creating queries in Power Query that help us to reconcile our two totals.
Archive and Knowledge Base
This archive of Excel Community content from the ION platform will allow you to read the content of the articles but the functionality on the pages is limited. The ION search box, tags and navigation buttons on the archived pages will not work. Pages will load more slowly than a live website. You may be able to follow links to other articles but if this does not work, please return to the archive search. You can also search our Knowledge Base for access to all articles, new and archived, organised by topic.
