
IRR is commonly used to help make project investment decisions. In this article, Mark Proctor returns to explore the use of the IRR function in Excel and potential alternatives.
Internal Rate of Return (IRR) is a profitability measure. It calculates the discount rate that makes the Net Present Value of the cash flows equal to zero.
In many organizations, IRR is commonly used to help make project investment decisions. Since, these projects are often modelled using Excel, this leads many to use the IRR function in Excel. However, as a concept and as an Excel function, IRR has some limitations.
In this post, we initially look at the limitations of IRR, then delve into the alternative XIRR and MIRR functions in Excel to see how they stack up.
IRR and XIRR have previously been covered in the Excel community here.
Understanding IRR
Before calculating IRR, we must understand the concept of a discount rate.In the context of IRR, the discount rate represents the minimum rate of return required for an investment based on its risk profile.
Below we have the cash flows for two projects.
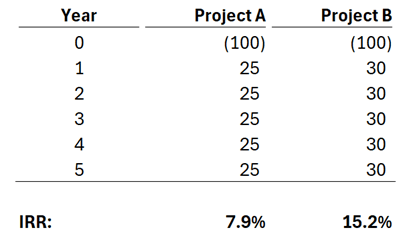
Let’s assume an organization’s discount rate is 10%:
- The IRR for Project A is 7.9%. Therefore, the organization should reject the investment.
- The IRR for Project B is 15.2%. Therefore, the organization should accept the investment.
IRR is only one measure and does not tell the full story. This is why other measures are essential to make an informed investment decision.
Calculating IRR in Excel
For calculating internal rate of return, Excel has the IRR function:
=IRR(values,[guess])
- Values: Array, or range of cells containing the cashflows
- [Guess]: Estimated rate of return. This is an optional argument, if omitted, the default is 10%.
Let’s take a look at an example.
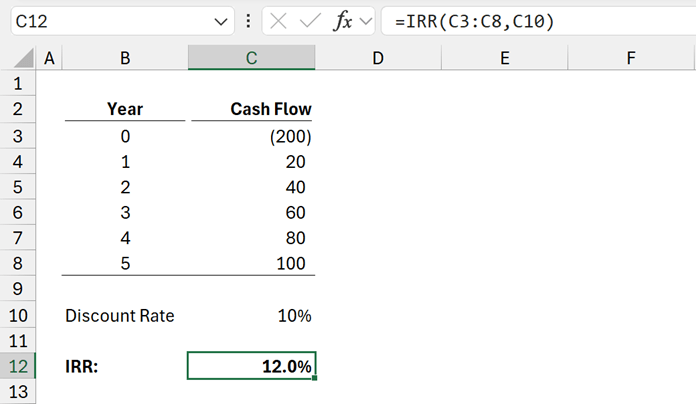
=IRR(C3:C8,C10)
The IRR calculates as 12.0%
Note: In the IRR function, blank cells are ignored and not treated as cash flow periods. Ensure any zero cash flows are shown as zero and not bank.
Problems with IRR
Excel’s IRR function has some issues.
- The IRR returns a single value. However, depending on the cash flow profile, it is possible to have multiple IRR results.
- IRR assumes cash flows occur at regular annual intervals.
IRR as a concept also has an issue. It assumes all returns from the project are re-invested back at the rate of the project, which may not always be possible.
Let’s see how we can resolve these issues.
IRR with multiple returns
Take a look at the following project cash flow.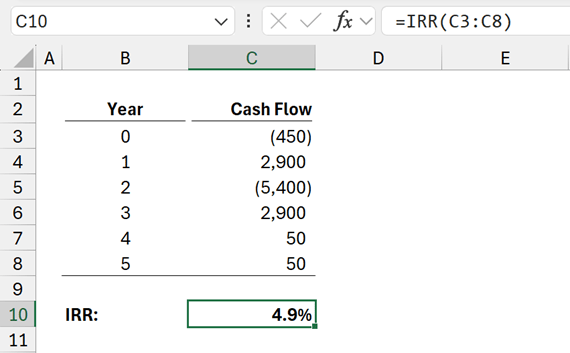
However, this is misleading.
If we calculate the NPV of the project at different discount rates, we see the NPV crosses the horizontal axis 3 times.
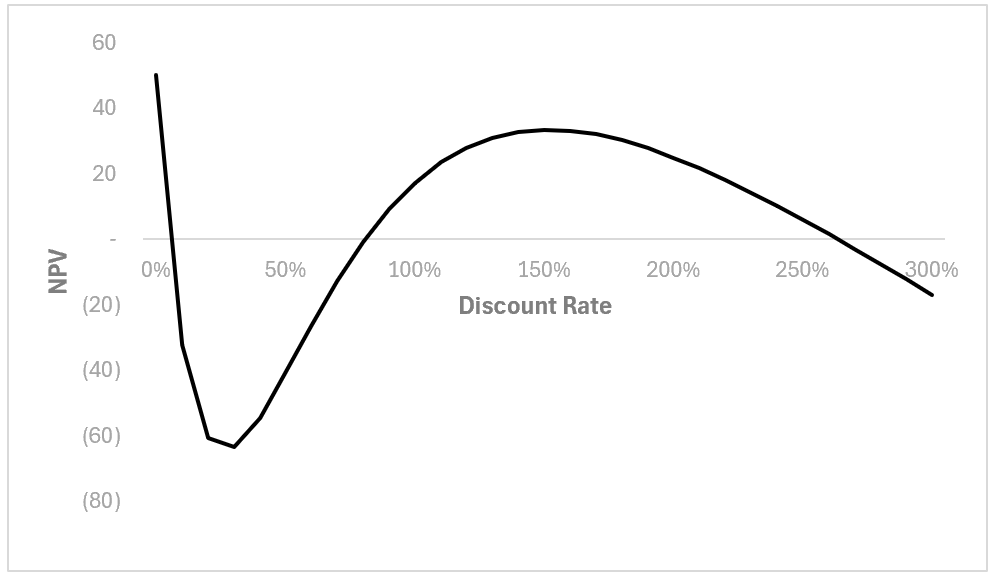
The value provided for the guess argument determines which of the 3 IRRs are returned.
If the Guess is 10%, IRR calculates as 4.9%, if the Guess is 50%, the IRR calculates as 80.8%.
There is no easy way to know how many IRRs there are unless we calculate all of them.
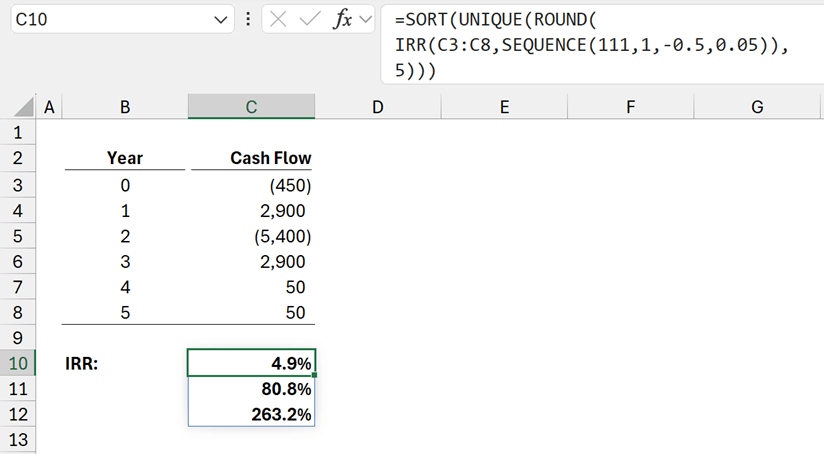
The formula in cell C10 is:
=SORT(UNIQUE(ROUND(
IRR(C3:C8,SEQUENCE(111,1,-0.5,0.05)),
5)))
SEQUENCE(111,1,-0.5,0.05) calculates a list 111 numbers in 1 column starting from -50%, with an interval of 5% (these should be cell values but are hardcoded for simple illustration); this provides a list from -50% to 500%. These are used as the guesses inside the IRR function to generate the array of IRR calculations.
Rounding the results to 5 decimal places, then applying UNIQUE and SORT, provides a list of multiple IRRs (4.95%, 80.8% and 263.2%).
Using this method, clearly shows that multiple IRRs exist.
There are limitations to this approach to be aware of.
- If the guess interval is too large, an IRR may be missed.
- Rounding is required to ensure the results returned are consistent to a specific number of decimal places.
- Results outside the range specified in the SEQUENCE function may not be identified.
- Requires the use of dynamic array calculations in Excel 2021 and Excel 365 only.
XIRR Function
The next limitation of the IRR function is the assumption of cash flows at consistent intervals. If cash flows occur at other intervals, then we cannot use the IRR function.
Look at the cash flow profile below.
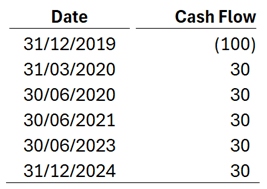
The cash flows are not at regular intervals. Instead of the IRR function, we can use the XIRR function.
The syntax of XIRR is
=XIRR(values, dates, [guess])
- Values: Same as IRR
- Dates: The dates at which the corresponding values occur
- [Guess]: Same as IRR
Let’s take a look at an example.
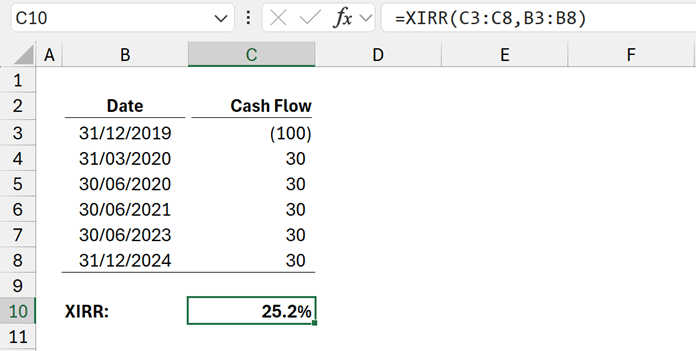
The formula in cell C10 is:
=XIRR(C3:C8,B3:B8)
This calculates the return as 25.2%.
Notes:
- While the function is called XIRR, this is still an IRR calculation. It is merely Excel’s way of providing the ability to calculate IRR with irregular periods.
- XNPV also exists for cash flows which don’t occur at regular intervals.
- Unlike IRR, XIRR does not ignore blank cells. Blanks and zeros are treated the same.
- XIRR requires the first cell in the Values argument to be negative.
- XIRR does not calculate based on times, it assumes all cash flows occur at midnight.
So, when should we use XIRR?
In financial modelling, cash flows are shown at specific intervals. Where those intervals are annual, then IRR and XIRR produce exactly the same result.
Even if the model is at different regular intervals, we can still use IRR by compounding the rate.
Look at the cash flow below. It is the same cash flow as shown for the XIRR example above.
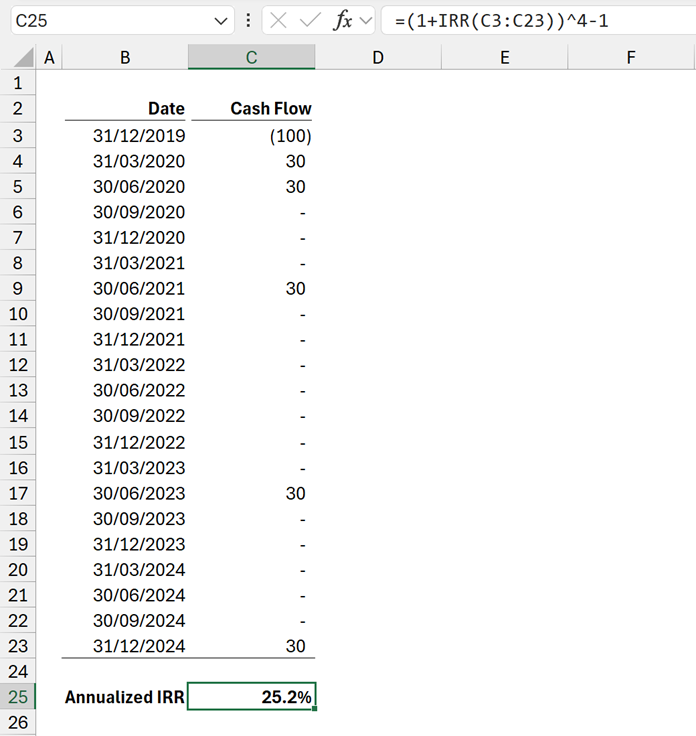
As the periods are quarterly, the basic IRR calculates a quarterly return. Therefore, the formula in cell F25 is the annualized return for quarterly flows.
=(1+IRR(F3:F23))^4-1
This shows that provided we have regular intervals of any lengths, we can use IRR instead of XIRR.
So, when should we use XIRR? There appear to be 2 use cases:
- When a financial model is based on time intervals which don’t quite reflect the return. For example: a monthly financial model, where the returns occur on the 3rd Tuesday of the month. In this scenario XIRR would provide a more accurate calculation.
- Simple investments containing irregular intervals which do not require the complexity of a detailed financial model.
MIRR Function
Another limitation of IRR is the assumption that funds are available at, and re-invested at, the same rate as the project.
However, for very high-yield projects this assumption may be unrealistic as it is unlikely an organization will have a portfolio of very high-yield projects to re-invest into.
Therefore, we have the MIRR calculation. It assumes funds are available at and re-invested at different rates to the project.
While XIRR is a different Excel function to calculate the IRR; MIRR is not. MIRR is a different calculation methodology to IRR.
The syntax of the MIRR function in Excel is:
=MIRR(values, finance_rate, reinvest_rate)
- Values: Same as IRR
- Finance_rate: The rate charged on the funds invested in the project.
- Reinvest_rate: The rate of return achieved on the funds returned by the investment.
Let’s take a look at an example.
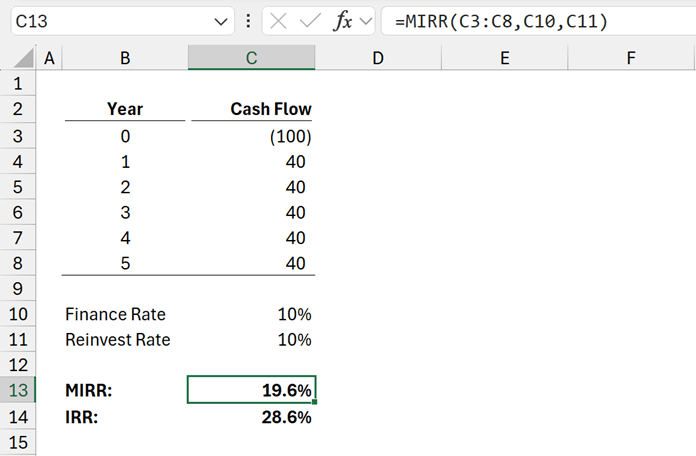
=MIRR(C3:C8,C10,C11)
This calculates the MIRR return as 19.6%. The equivalent IRR for the same cash flow is 28.6%.
The more project returns diverge from the reinvest rate, the greater divergence between the MIRR and IRR calculations.
So, when should we use MIRR?
Since IRR and MIRR are different calculations, then we can use both. They are not mutually exclusive. IRR by itself is not an all-encompassing decision metric; we need to take other measures into account; so why not include MIRR.
For, one-off, high-yield projects, then MIRR will provide a more accurate measure for the return on the cash flow.
Where an organization undertakes a variety of activities, the finance_rate and reinvest rate provide more reasonable assumptions about the use of funds.
However, the concepts behind MIRR are less well understood, and may cause more confusion.
Archive and Knowledge Base
This archive of Excel Community content from the ION platform will allow you to read the content of the articles but the functionality on the pages is limited. The ION search box, tags and navigation buttons on the archived pages will not work. Pages will load more slowly than a live website. You may be able to follow links to other articles but if this does not work, please return to the archive search. You can also search our Knowledge Base for access to all articles, new and archived, organised by topic.
