
Excel Tables – so much more than just a pretty format
When Tables were first introduced into the Windows versions of Excel in Excel 2007, many people saw them as another Excel formatting ‘gimmick’. This view was supported by the inclusion of the Format as Table command in the Styles group of the Excel Home Ribbon tab. However, it soon became apparent that Tables were much more important than that, and that they had a significant role to play in many aspects of automating Excel.
In this series, we are going to revisit some of the basics of working with Tables in Excel before moving on to examine practical uses and more advanced features. As well as helping to understand the capabilities and uses of Tables themselves, knowing more about how Tables work can be useful when working with Power Query which loads its results as Excel Tables.
Creating an Excel Table
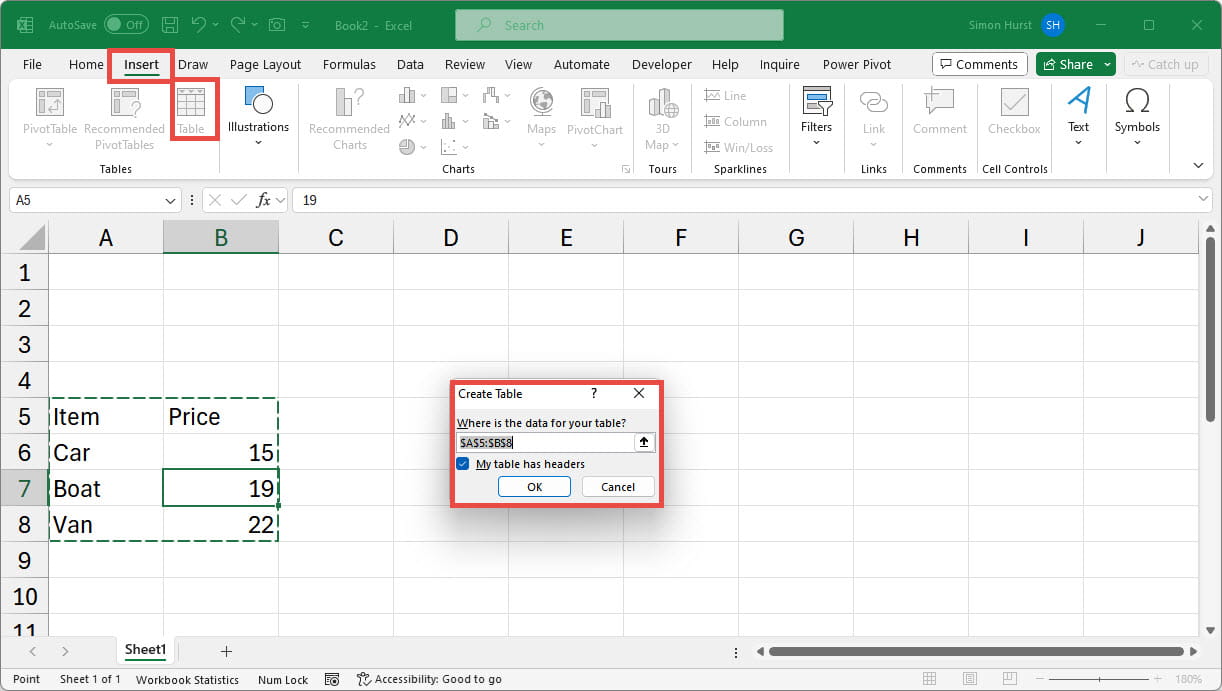
Any cell, or block of cells, can be turned into an Excel Table. With the required range of cells selected, the Table can be created by using the Format as Table command mentioned above, the Table command in the Tables group of the Insert Ribbon tab or, perhaps most efficiently, by using the Control+t keyboard shortcut. The Create Table dialog will appear confirming the range of cells selected and including a ‘My table has headers’ check box. Where the range contains existing data, and there is an obvious header row, this check box will default to being ticked.
If you have already entered the data that you want to turn into a Table, there is normally no need to select the range before creating the Table. As long as there are no blank rows or columns in the range, you can select a single cell and use one of the Table commands, and Excel will work out the range of contiguous cells for you:
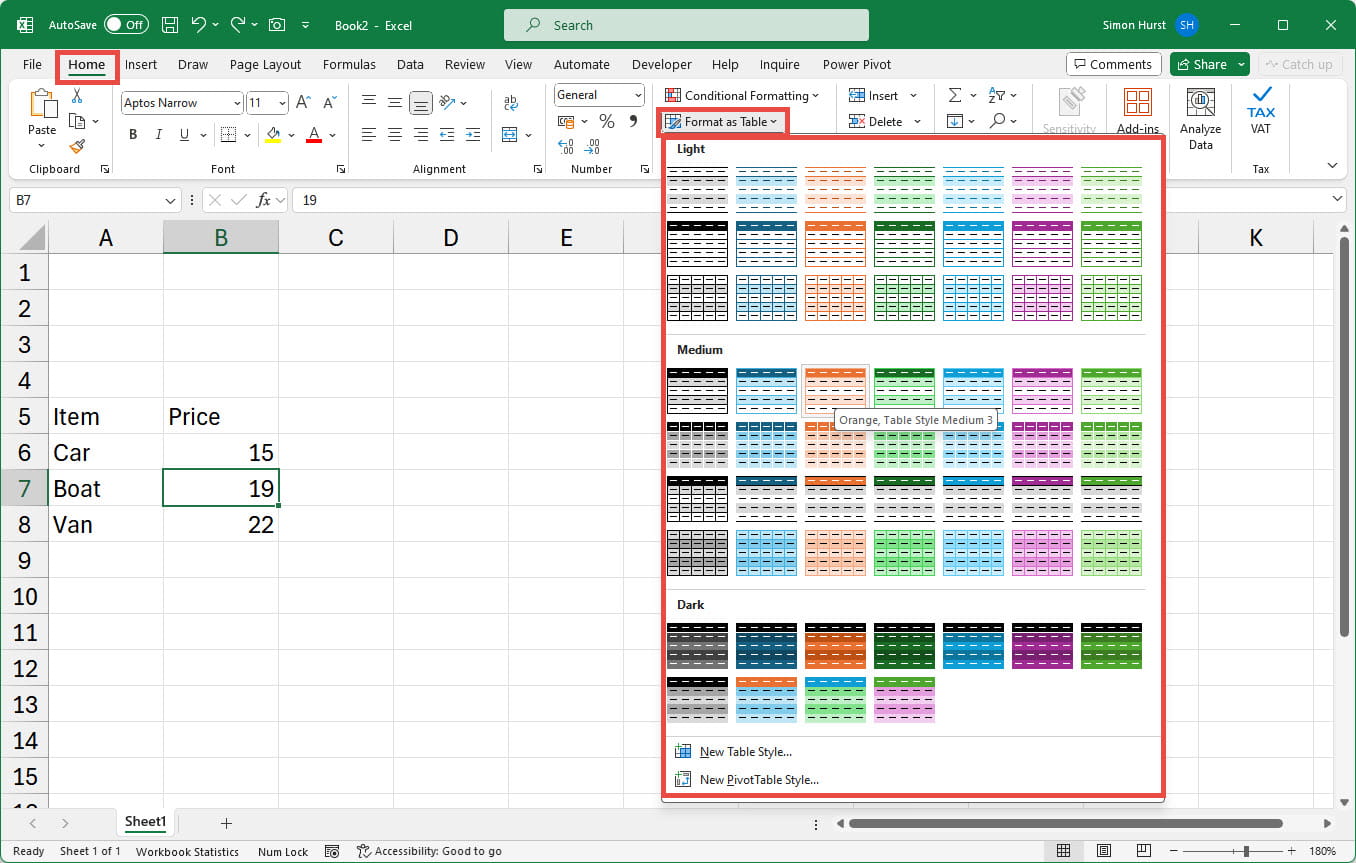
Using Insert, Table or the Control+t shortcut will apply the default Table Style. If you want more control over the formatting of your Table, you can use the Format as Table command to be able to choose from the existing Table Styles:
Alternatively, you can always change the formatting applied to an existing Table. Whenever all, or part, of an existing Table is selected, a contextual Table Design tab will be available, containing specific formatting options in the Table Style Options and Table Styles groups:
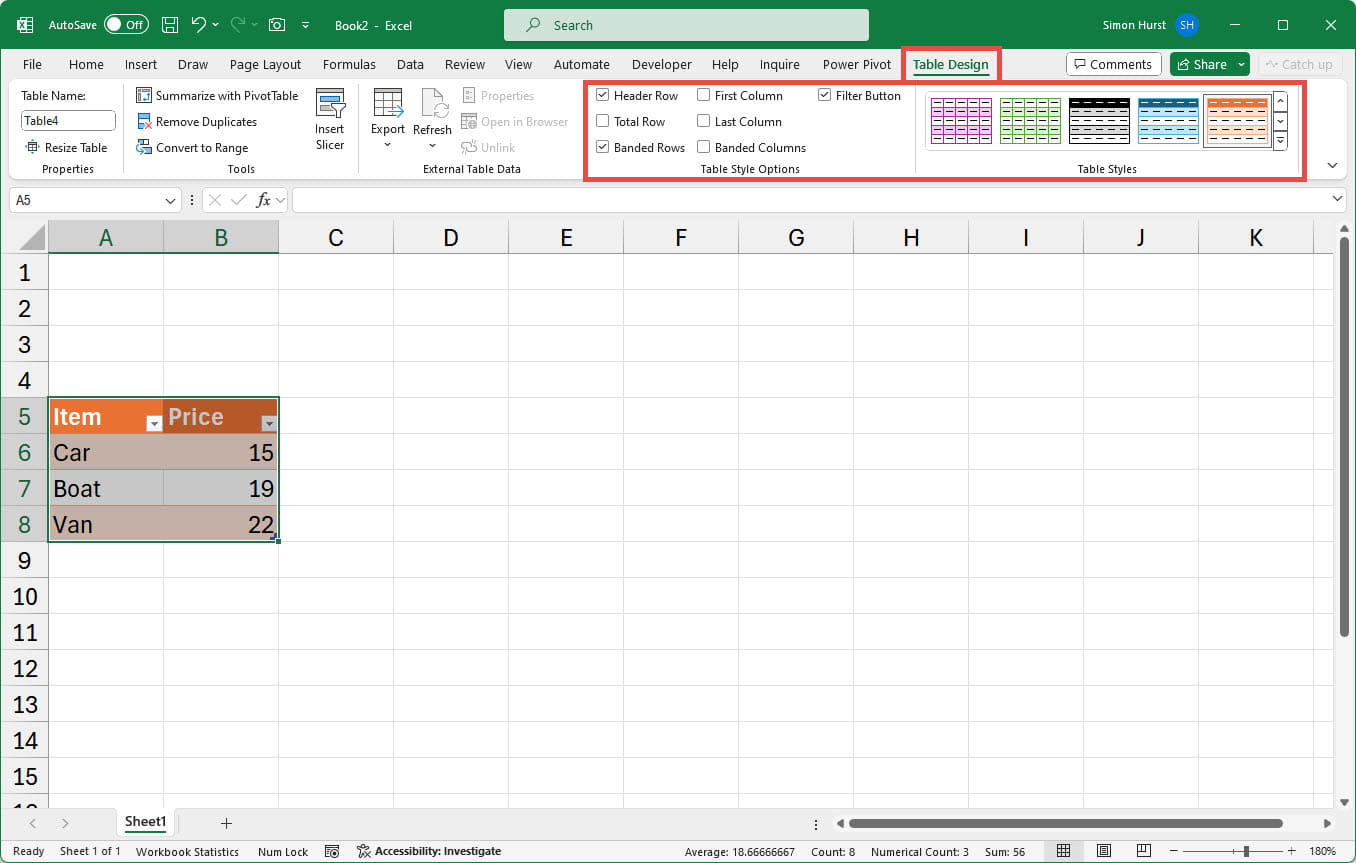
Table auto expansion and formula automation
Perhaps the most powerful feature of Excel Tables is also one of the simplest. If you type additional entries in cells to the bottom or to the right of an existing Table, the Table will automatically expand to include the newly entered data. There is also a ‘handle’ in the bottom corner of an existing Table that can be dragged to increase, or decrease, the dimensions of the Table manually.
On its own, auto expansion wouldn’t be very significant, apart from in speeding up formatting. However, references to the contents of a Table column also adapt automatically to changes in Table dimensions. This means that, using a Table, formulas throughout a workbook can include new entries with no need to change any references manually.
Obviously, this can save a great deal of time and effort but, in addition, it can make it less likely that an important formula will be left referring to the wrong range of cells. One of the most prominent spreadsheet scandals of recent years could, perhaps, have been avoided had Tables been used. Two prominent professors of economics, Carmen Reinhart and Ken Rogoff, co-authored an influential paper on the economic effects of the policy of austerity entitled “Growth in a Time of Debt” that was widely used by politicians to justify austerity measures after the 2007/2008 financial crisis. One of their key conclusions was undermined by a spreadsheet error that led to 5 items of data being omitted from a calculation of a significant average value.
As well as having been referred to many years ago in the Excel Community, this example of a spreadsheet mishap was recently highlighted by the mathematician Hannah Fry in one of her ‘Uncharted’ podcasts: Devil in the Detail
Conclusion
You can explore Tables; Excel errors and a great deal more, in the ICAEW archive:
Archive and Knowledge Base
This archive of Excel Community content from the ION platform will allow you to read the content of the articles but the functionality on the pages is limited. The ION search box, tags and navigation buttons on the archived pages will not work. Pages will load more slowly than a live website. You may be able to follow links to other articles but if this does not work, please return to the archive search. You can also search our Knowledge Base for access to all articles, new and archived, organised by topic.
