The signing of the UK-New Zealand Free Trade Agreement on 28 February 2022 prompted us to take a look at New Zealand’s public finances, one of the few developed countries with public assets in excess of public liabilities, and a pioneer of accruals accounting in government.
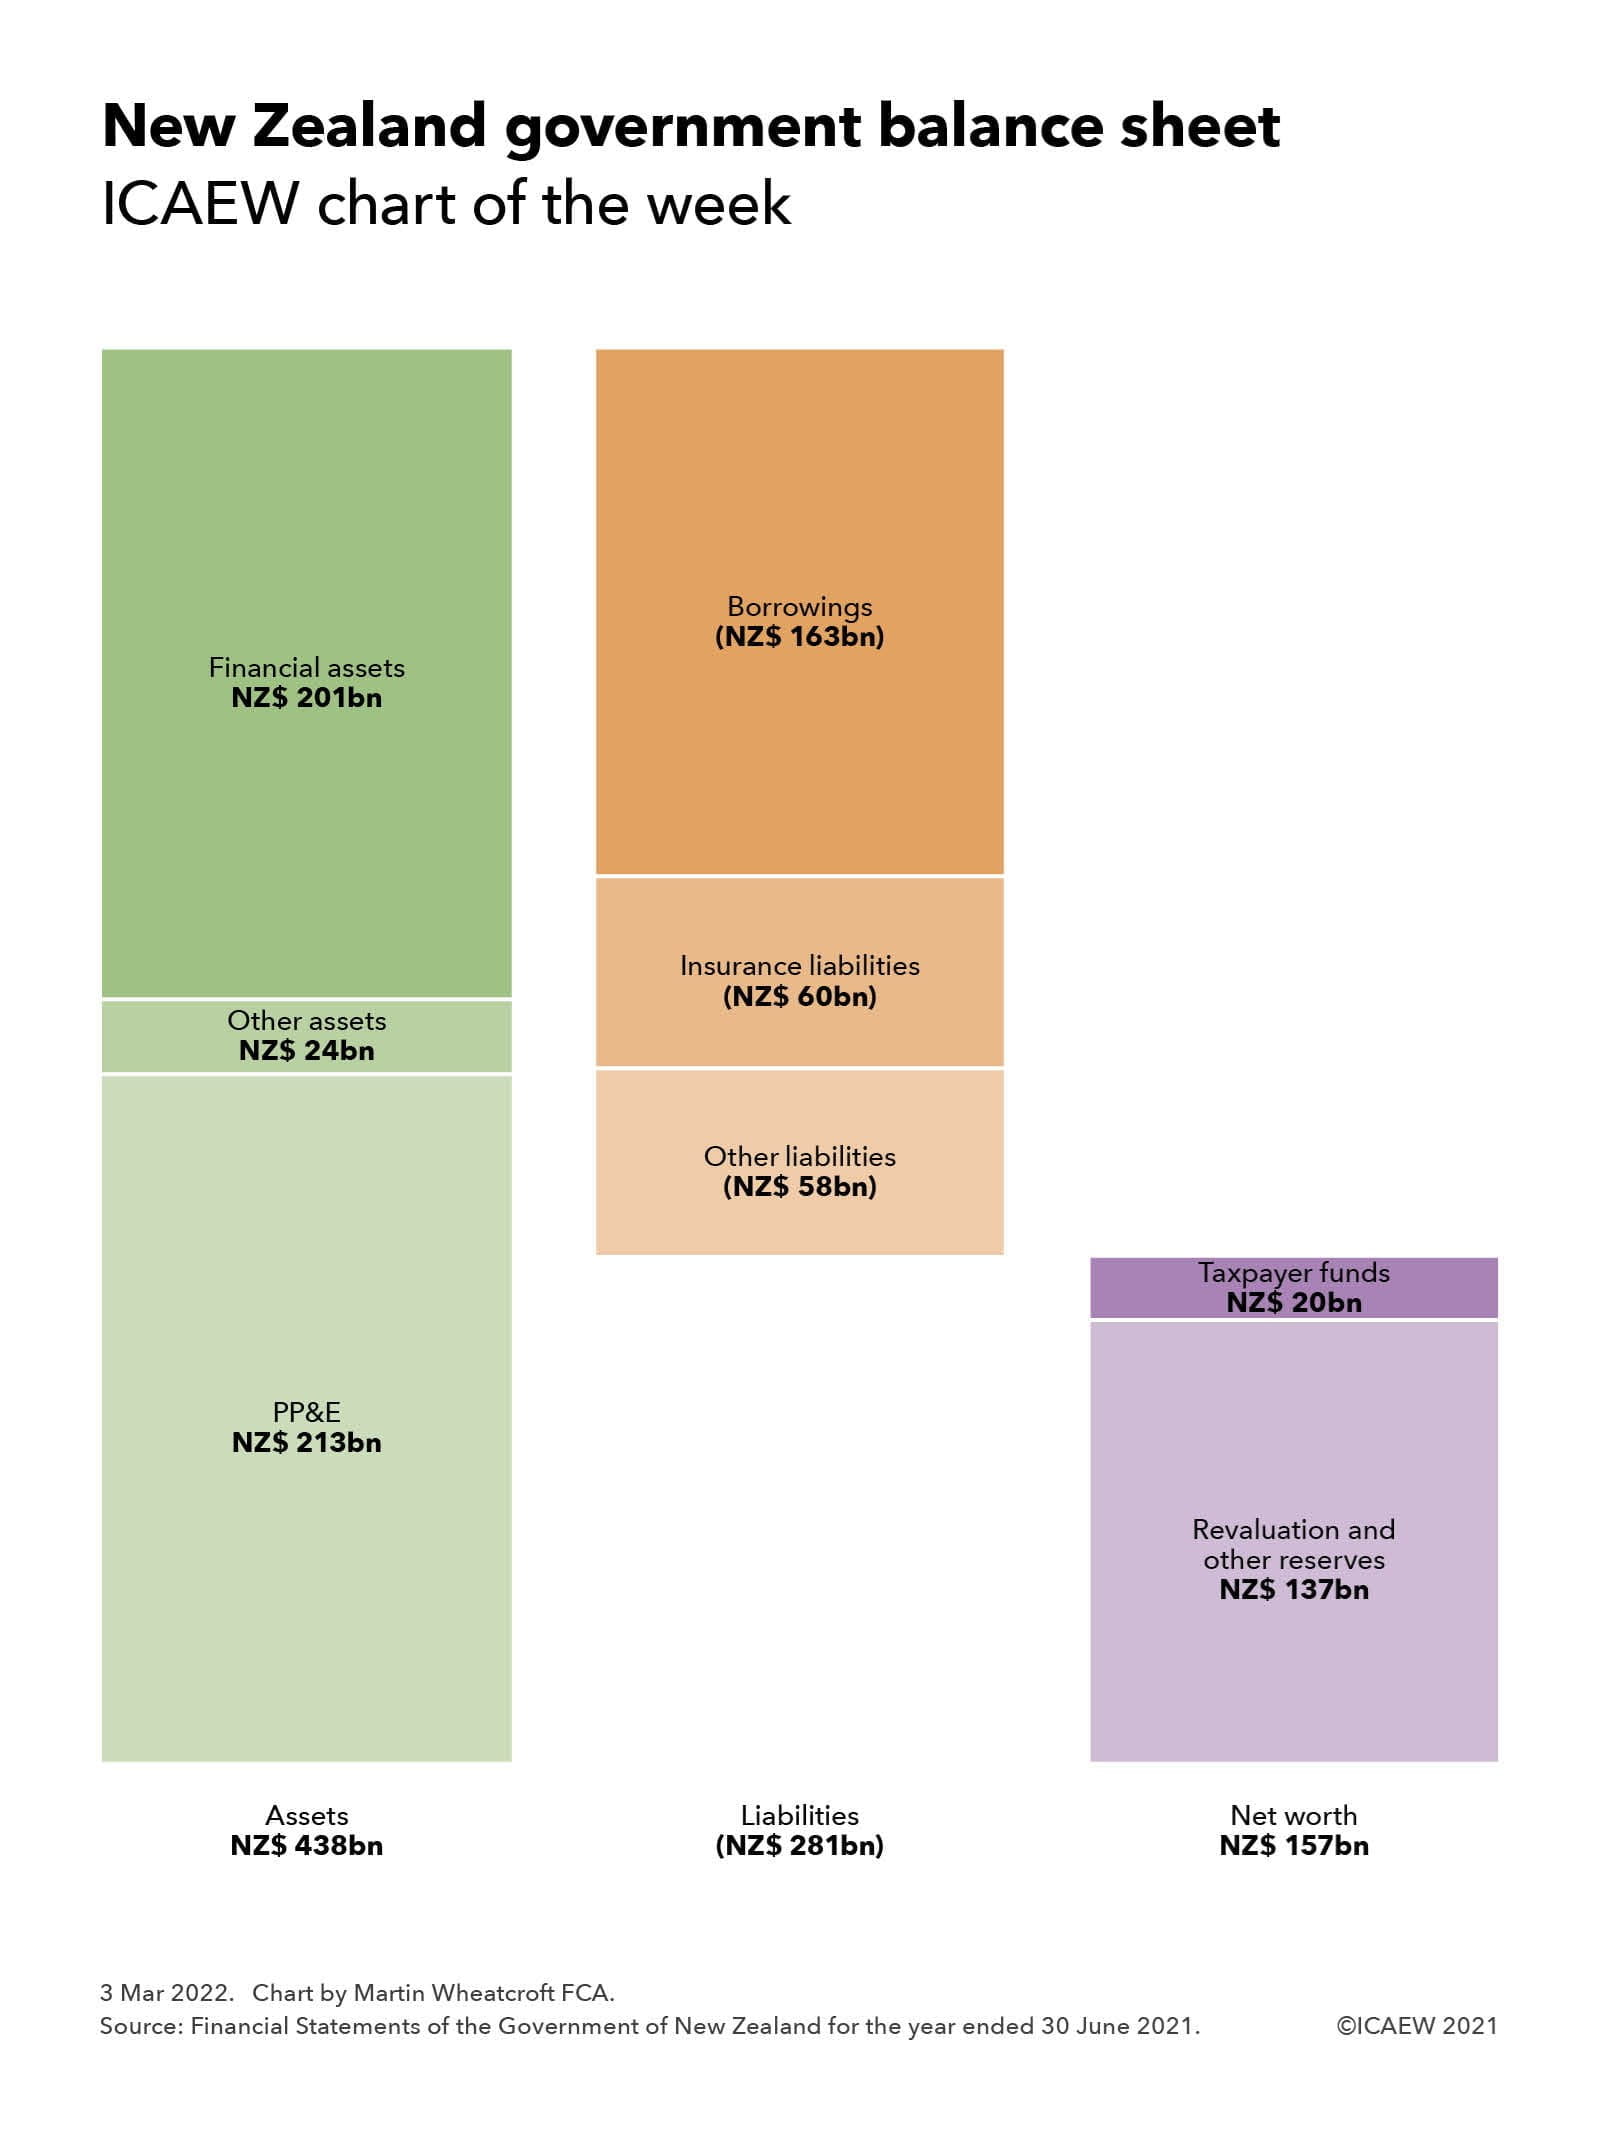
Our chart this week summarises the total crown balance sheet reported in the Financial Statements of the Government of New Zealand for the year ended 30 June 2021, comprising assets of NZ$438bn (£223bn) less liabilities of NZ$281bn (£143bn) to give net worth of NZ$157bn (£80bn).
New Zealand is a leading country in adopting accruals accounting for use in government, with the financial statements prepared in accordance with New Zealand-adopted accruals-based International Public Sector Accounting Standards (IPSAS), which are aligned with IFRS with some adaptation for the public sector. The New Zealand government not only uses IPSAS for financial accounting and reporting, similar to how the UK’s Whole of Government Accounts is based on IFRS, but they also use these standards for budgeting, management accounting and fiscal target setting. This contrasts with the UK, which uses a distinct UK-specific ‘resource’ accounting framework for budgeting and management accounting, and the statistics-based National Accounts system for fiscal target setting.
The asset side of the balance sheet includes NZ$213bn (£109bn) of property, plant and equipment, other non-financial assets of NZ$24bn (£12bn) and financial assets of NZ$201bn (£102bn). The latter includes marketable securities, student loans, residential loans and other financial investments in addition to receivables and cash.
Liabilities include NZ$163bn (£82bn) of borrowings, insurance liabilities of NZ$ 60bn (£31bn) and other liabilities of NZ$58bn (£30bn). Insurance liabilities are relatively high compared with many other countries as a consequence of New Zealand’s unique national no-fault accident compensation scheme that covers everyone in the country, including visitors.
Net worth is made up of taxpayer funds of NZ$20bn (£10bn) and reserves of NZ$137bn (£70bn), with the latter comprising a property revaluation reserve of NZ$134bn (£68bn) and minority interests of NZ$6bn (£3bn) less negative reserves of NZ$3bn (£1bn) principally relating to defined benefit retirement plans and veterans disability entitlements.
With a population of 5.1m, net worth on a per capita basis at 30 June 2021 is equivalent to approximately NZ$31,000 (£16,000) per person, comprising NZ$86,000 (£44,000) in assets per person less NZ$55,000 (£28,000) in liabilities per person. This compares with the approximate negative net worth of £37,000 per person based on the UK Whole of Government Accounts at 31 March 2019, comprising £31,000 in assets per person less £68,000 in liabilities per person.
While some caution needs to be taken in comparing these amounts given differences in accounting policies and the exclusion of local government from the New Zealand numbers, they do provide an insight into how on a proportional basis the New Zealand public sector is much better capitalised than the UK public sector.
While there are significant differences between the economies of New Zealand and the UK that no doubt explain the respective strengths and weaknesses of their public balance sheets, the presence of accountants in New Zealand’s highest office, most recently Sir John Key (prime minister 2008-2016), may also have something to do with it.


