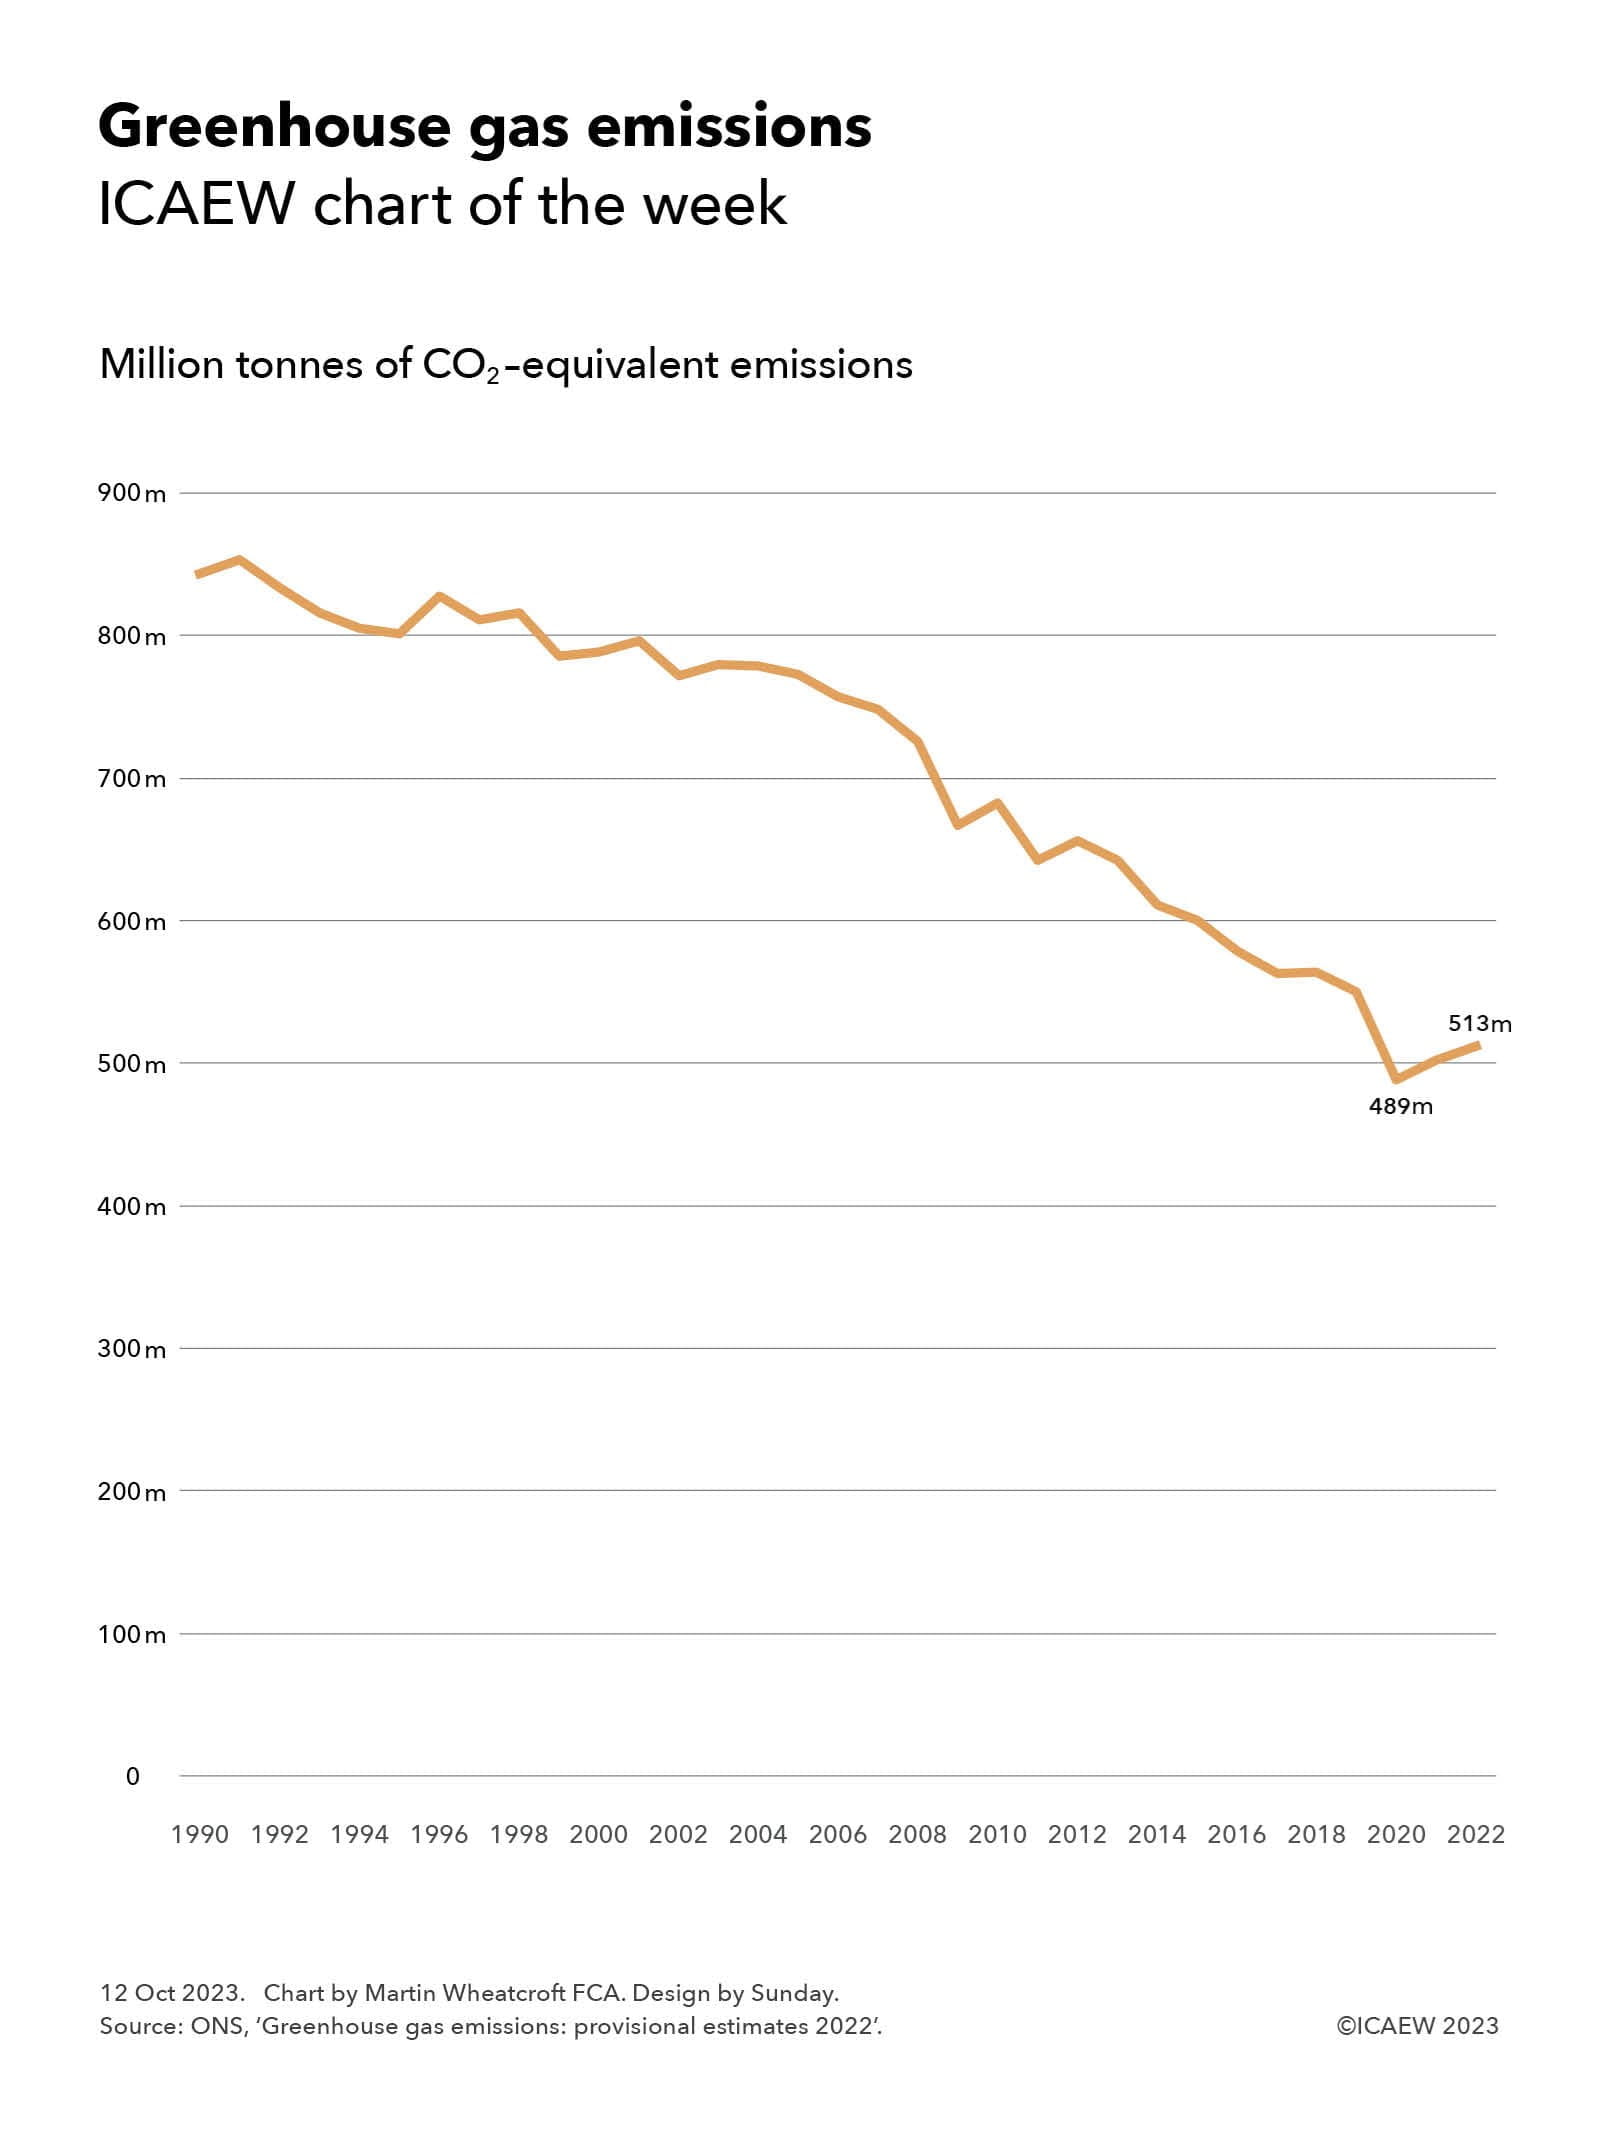
The Office for National Statistics (ONS) recently reported provisional numbers for greenhouse gas emissions in 2022, reporting that UK residents and UK-resident businesses emitted a total of 513m tonnes of carbon dioxide equivalents (tCO2e).
Our chart this week shows the overall trend since 1990 according to the ONS. Emissions were 843m tCO2e in 1990, rising to 853m tCO2e in 1991, from which point they have declined in most years since then apart from the odd upward blip.
The 513m tCO2e provisionally estimated to have been emitted in 2022 is up 2% over 2021 and just under 5% higher than the 489m tCO2e emitted during 2020, the first year of the pandemic when much of the country was locked down.
The good news is that this is still 7% lower than the 551m tCO2e emitted during 2019.
This disruption to the downward trend is primarily due to the pandemic, which saw emissions drop by a massive 11% in 2020 compared with 2019, before rising by 3% in 2021 and 2% in 2022.
The hope is that the downward trend will resume in 2023 and 2024 as decarbonisation efforts continue.
Most of the fall in emissions since 1991 has been delivered by the shift from coal to gas and renewable sources in electricity generation, combined with greater energy efficiency in appliances and equipment – what many commentators call “the easy bit”. The next stages of decarbonisation will be much harder as it involves switching everyone from fossil-fuel-powered vehicles to electric, completing the shift to renewable electricity generation, decarbonising most industrial processes and radically changing how we heat our homes and offices.
- Read ICAEW Insights article: Investors alarmed at UK net zero policy uncertainty
- See our previous chart of the week on the path to net zero
- Read more about how accountants can play their part in the ICAEW Climate Hub
Latest charts
Recommended content
ICAEW Community

Public Sector Community
The go-to place for guidance on issues affecting finance professionals working in and with the public sector. With a range of dynamic services, ICAEW provides valuable tools, resources and support tailored to the public sector.
Resource

More economic insight
ICAEW works with Oxford Economics to provide useful insight and timely intelligence for finance professionals and their clients.
Read moreResource

Energy crisis hub
Analysis of how supply difficulties, rising electricity prices and sanctions against Russia are contributing to turmoil in energy markets. Find out what business can do to lessen the impact.
Find out more