
Q&A
I have a number of detailed nominal ledger with multiple account headers. I need to delete the header but include the account number into a column to make it into a usable table. Can power query help with that?
First of all, If you have a set of data that you’d like to work with in Power Query, and can’t see how to do it, please send an example to excel@icaew.com (after removing any sensitive and confidential information) and we might be able to use it as the basis of a new ‘challenge Power Query’ series.
Without seeing the exact structure it’s difficult to provided detailed instructions as to how to do this but, as long as there is some consistency about how the data is set out, it will almost certainly be possible to turn it into a usable table. As I (rather hurriedly!) mentioned at the end of the webinar, a couple of the other community webinars on Power Query might help in providing the solution:
This webinar showed how to use a Code Chart table in an Excel worksheet to merge with a table of transactions to look up information about each nominal account.
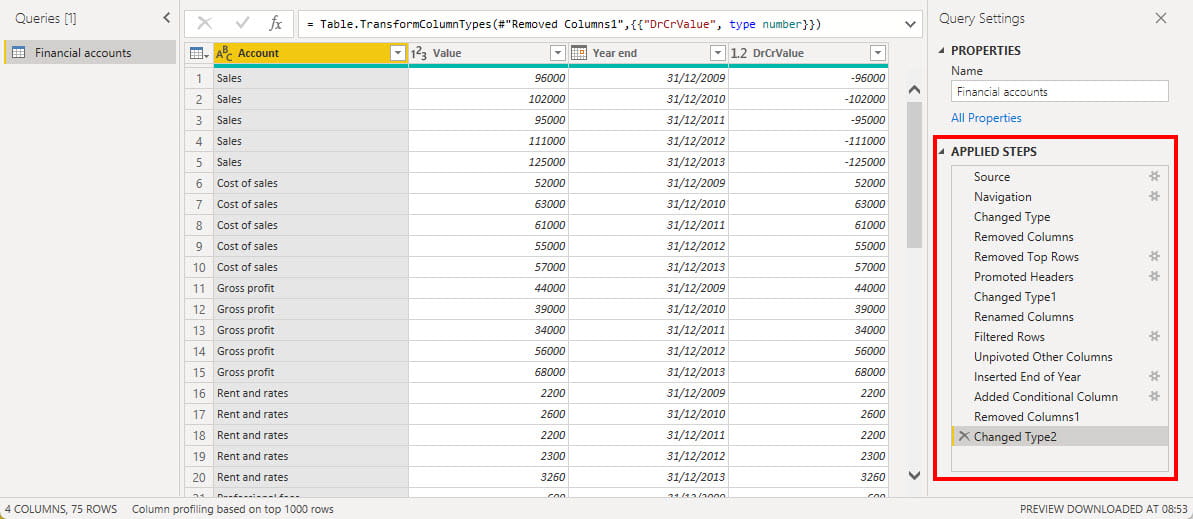
This webinar looked at the use of Power Query as a part of Power BI, rather than in Excel, but the techniques used are the same. We started with a formatted set of accounts in an Excel worksheet and transformed it into a usable table on which to base a series of Power BI visualisations:
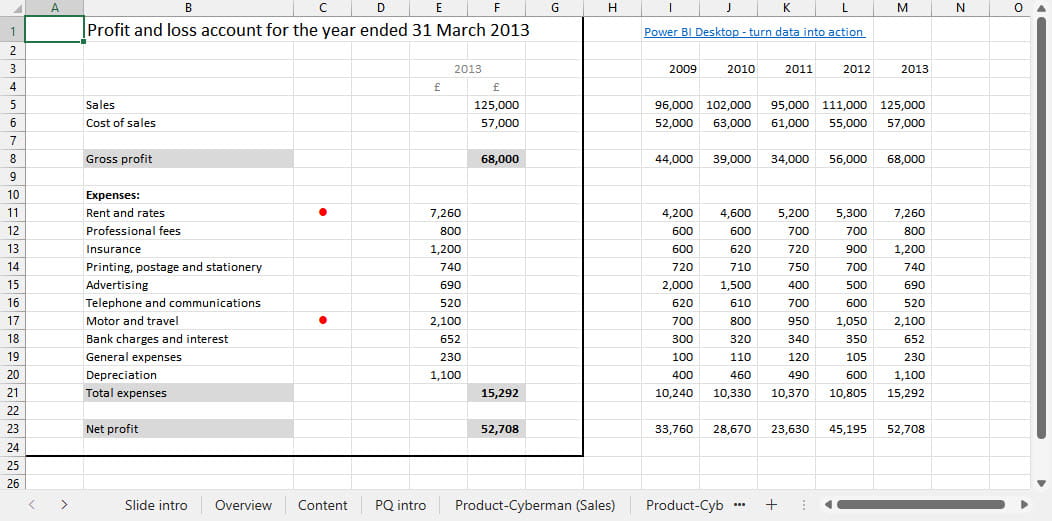
I have assumed a repeating sequence based on three header rows for each nominal account: the first containing the Account number, the second the Account description and the third being a spacer row. We then have a row of headers for the actual transactions.
Having read the data into the Power Query editor, we can use the ‘: ‘ (colon followed by space) delimiter to first split our leftmost column. This creates a new column that contains each of our account numbers, with our account descriptions on the row below. Assuming that none of our Date values contains a colon immediately followed by a space, all the other rows in our new column will contain ‘null’. We can use the Transform, Fill Down command to fill in all the nulls with our Accounts description (the use of Fill Down was covered in the TARDIS webinar). To add our account code, we add a Conditional Column that includes the content of our account number/account description column only when our first column contains the words: ‘Account number’ – remembering that comparisons in Power Query are always case sensitive. We can then use Fill Down again on this column to give us separate columns for the account description and the account number:
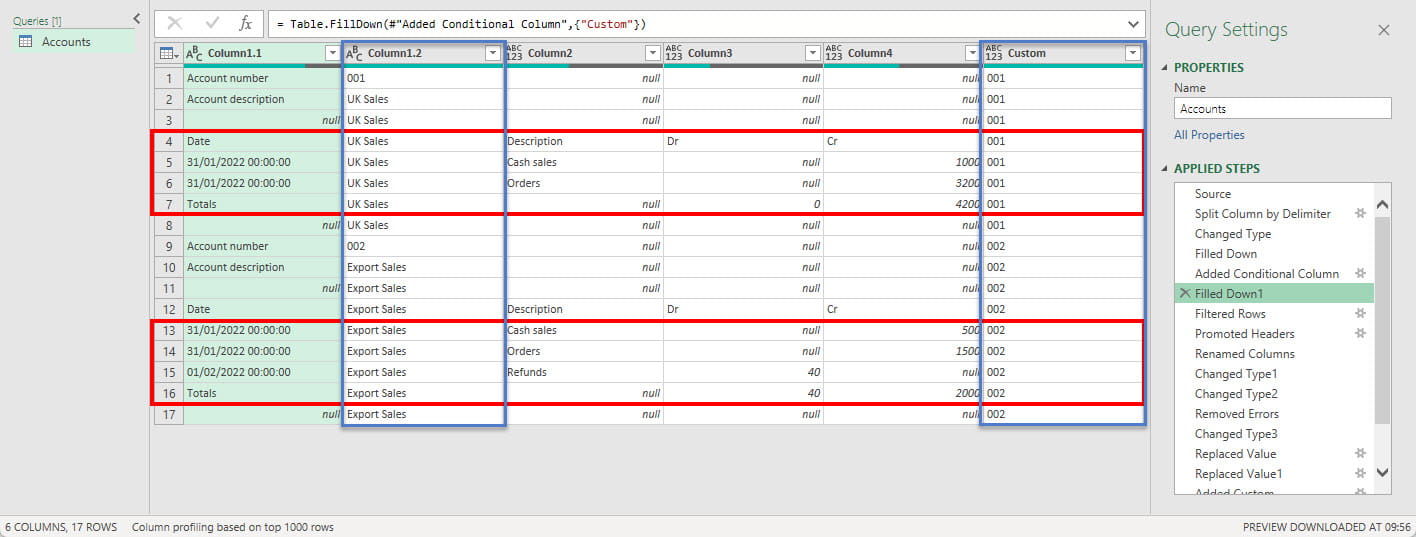
Having got our Account number and Account description for each row of our data, we can then filter our columns to only include those that have non-null values for Column3 or Column4. Then we just have to promote the first row to become our header row, change the Data Type of our Date column and remove any error rows that result, before changing the Data Types for our other columns and adding a Value column that subtracts our Cr column from our Dr column.
There are many Power Query commands that can be used to work on data in this way so, as long as some repeatable logic can be used to identify rows and columns with specific content, Power Query should be able to extract the required data into a table.
If the folders were renamed, would the files still pull through?
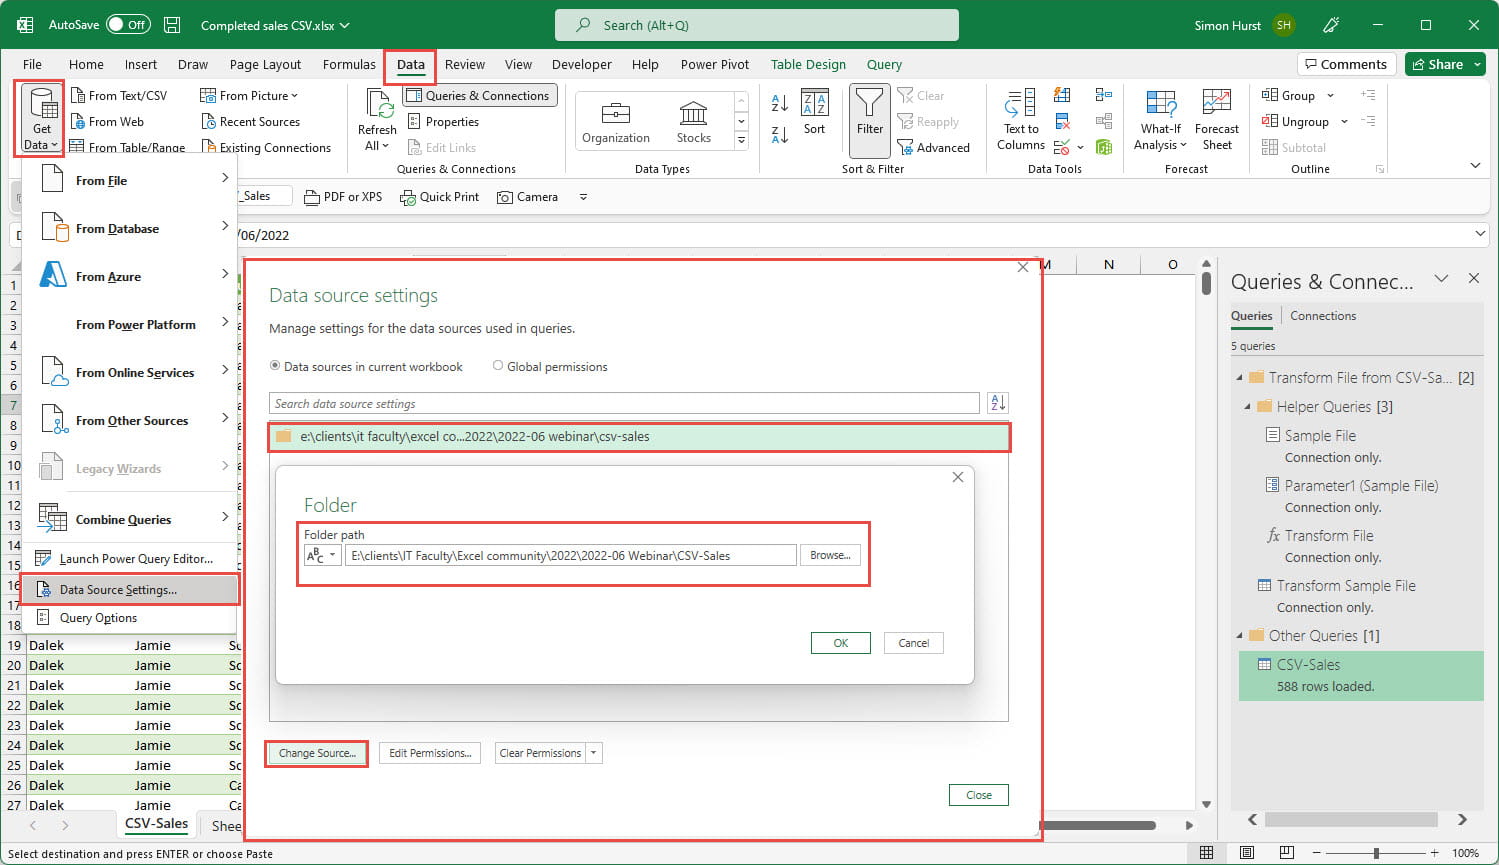
The TARDIS webinar looked at automating a reporting process by pulling in all the relevant files from a particular folder so that, if new files were added to that folder, just refreshing our output table would include the required values from those new files with no additional manual intervention. As the question suggests, there would be an issue if the folder path was changed in some way. Power Query makes this reasonably easy to deal with. In the Get &Transform Data group of the Data Ribbon tab, the Get Data dropdown includes a Data Source Settings… command. This allows you to select the source and use the Change Source… button to Browse to the new location. The Data Source Settings command is also available within the Home Ribbon tab of the Power Query editor screen:
What are the key differences between Power Query and the Data Model? Are there particular scenarios in which one works better than the other?
The Excel Data model can be accessed using the Manage command in the Power Pivot Ribbon tab. There is certainly an overlap with the features available in the Data Model and Power Query. Both allow the import of tables of data from external sources or an Excel workbook and allow the addition of columns that perform calculations based on the columns in that data. In addition, both allow separate tables to be joined/merged to combine data from multiple tables for reporting. Power Pivot also allows complex calculations to be performed using the Data Analysis Expressions functions (DAX). These can be more efficient than trying to create calculations within Power Query or the tables in the Data Model itself, because they can be used to create ‘Measures’ within a Power Pivot report that are only calculated in each cell when needed in the report, rather than having to be calculated for every row in the underlying data. There is a brief Microsoft article setting out the relationship between the two features here:
Hi Simon - thanks for this, which is incredibly useful! It has however, made me realise I need a more basic level introduction to Power Query. Is there something - perhaps a webinar recording - already within the excel community that I can access to go over and learn the basics?
Great question (and thanks, glad that you found the webinar useful). Yes, there are a few webinars that you might find useful and your question reminded me that I had forgotten to mention at the outset (sorry!) that my intention was to go through the techniques quite quickly this time because other webinars were available that took a more step-by-step approach:
- 10 everyday problems that Power Query solves best
- Introduction to Power Query
- Webinar: Power Query - how to get started
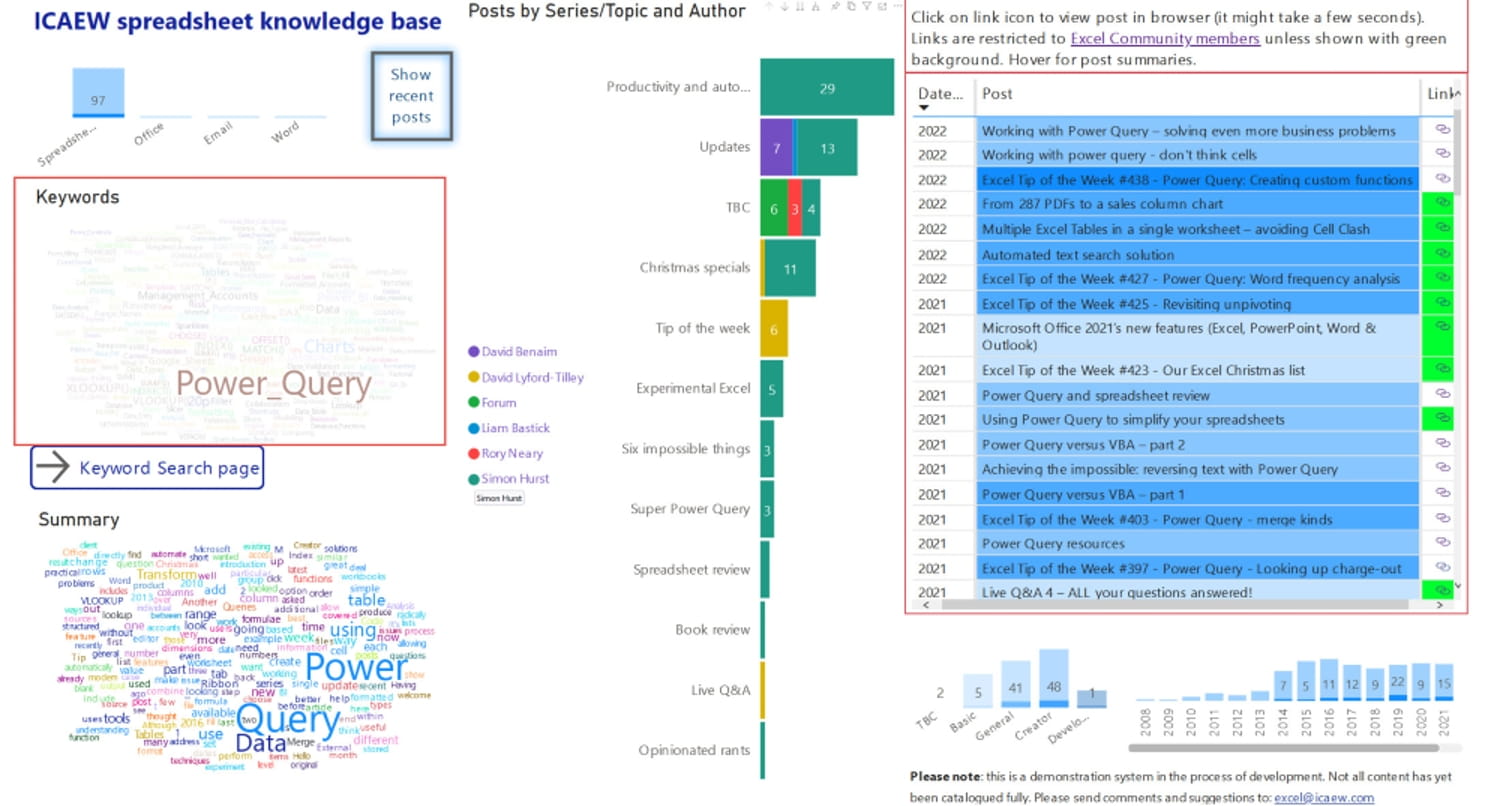
There are also many articles in the Excel Community that can help with the use of Power Query. Perhaps the easiest way to browse through them is to use the article archive portal and click on the Power_Query Keyword:
The 'Open in full-screen mode' icon in the bottom right-hand corner of the embedded report should show the contents at a more readable size with the Escape key returning you to the post.
Will this recording be made available as most definitely will need to refer back to this
Yes, indeed:
How on earth did you create the remarkable TARDIS materialisation/dematerialisation effect?
I’m really pleased that someone asked this. I created several different workbooks with the TARDIS picture included with different levels of transparency. Each one was saved 5 seconds after the previous one. Then I simply moved backwards and forwards in time while displaying the workbooks in the same geographical location…
Archive and Knowledge Base
This archive of Excel Community content from the ION platform will allow you to read the content of the articles but the functionality on the pages is limited. The ION search box, tags and navigation buttons on the archived pages will not work. Pages will load more slowly than a live website. You may be able to follow links to other articles but if this does not work, please return to the archive search. You can also search our Knowledge Base for access to all articles, new and archived, organised by topic.
