Visio now has a free web-based version for Microsoft 365 customers since late 2021.
If you’re creating diagrams in PowerPoint, you may consider switching to Visio as it allows you to:
- Add new shapes with fewer clicks
- Add words/phrases in the lines between boxes
- Rearrange the whole diagram easily
- Start from dozens of templates
The free tier allows users to build flow charts, network, cycle, process & Venn diagrams, business matrices and certain other diagrams and export as image files but for more advanced diagram types including org charts, mind maps, floor plans, Gantt charts and more elaborate editing & exporting options you will need to use the Visio Desktop app which requires an additional license, see more information here. The online version is a nifty tool in the pen knife and that is what we will discuss on this blog post.
This is the fifth blog post about the forgotten Office apps, after 2021’s posts covered Lists & Forms for alternatives to data collection, as well as Word replacements: For anything people typically PDF, I use Sway and OneNote to replace tasks which are sometimes done on Word (click links to read the other blogs I wrote in this series). You can learn how to use the app in this video:
Launching Visio
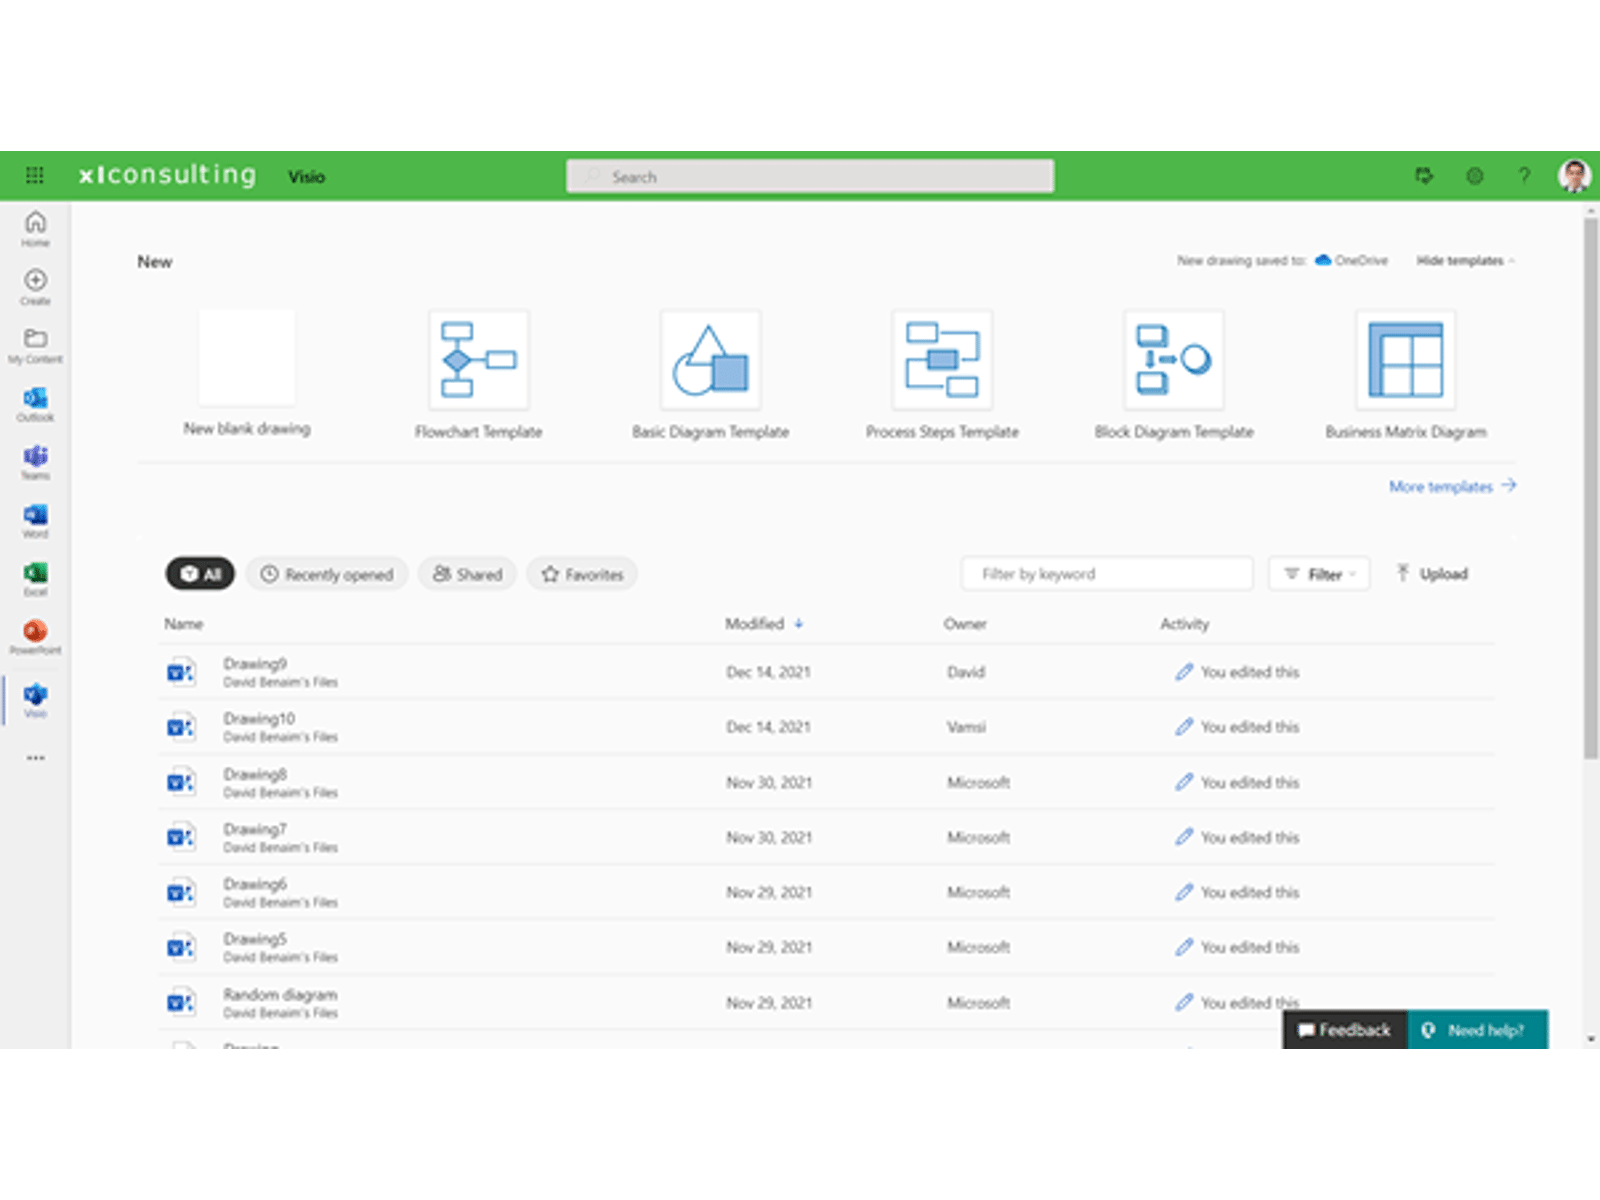
From the app launcher on the top left of your browser, Visio will be located near the bottom of the list (but you may need to click “All apps” to get there if your view is limited). Like other Office Apps, Visio’s home screen then shows “New” on the top left, templates across the top and previous diagrams below (and some filters for which diagrams to show).
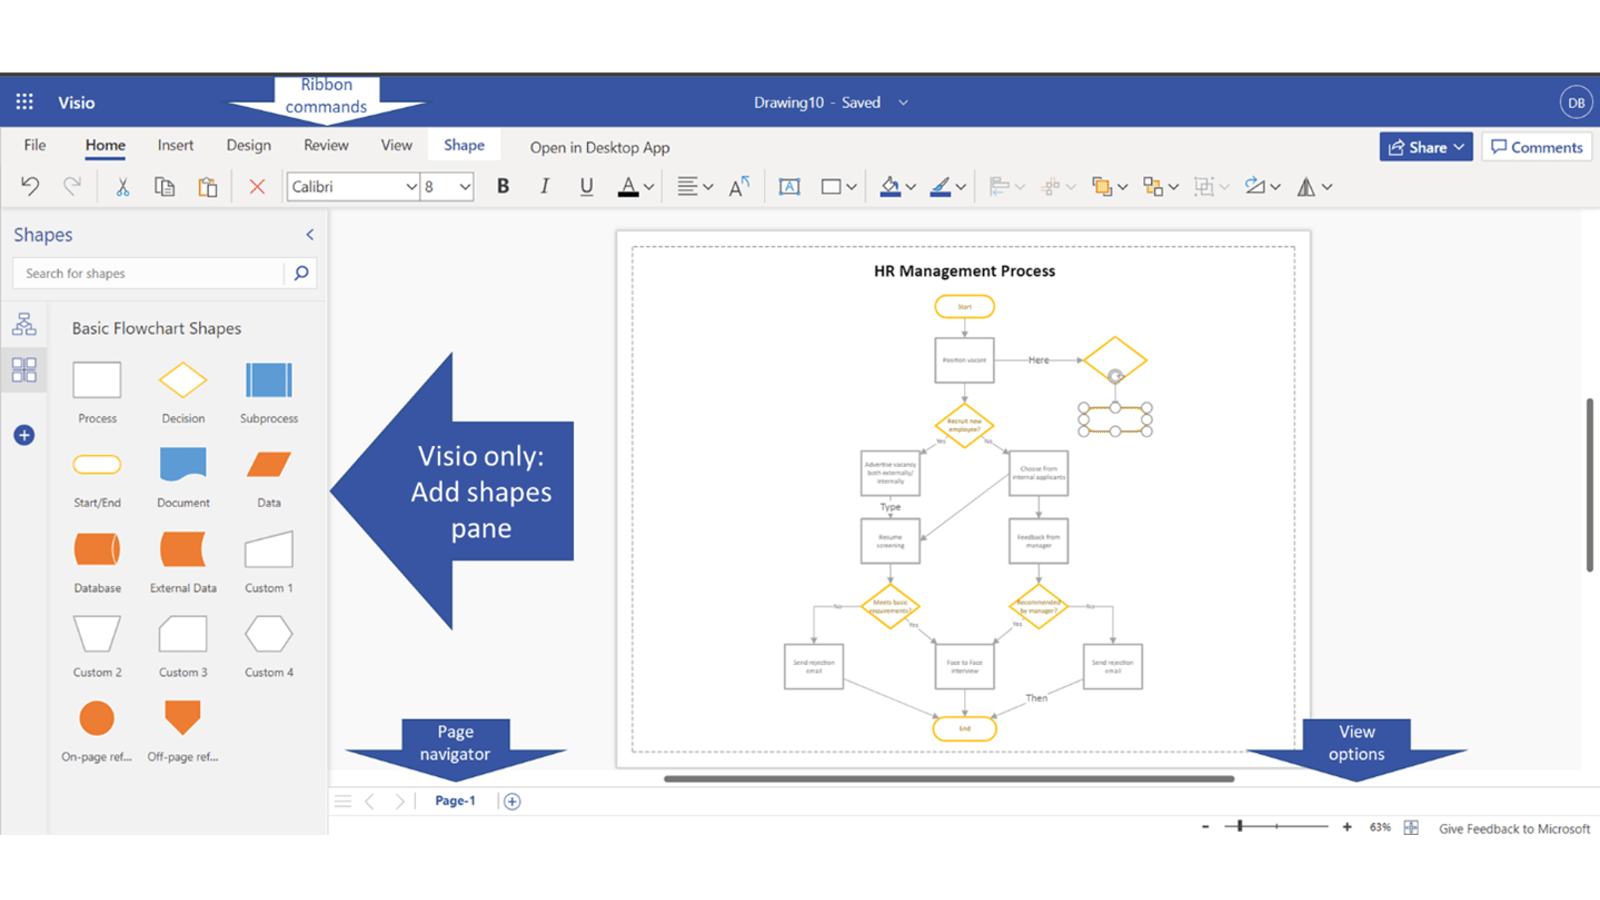
The Visio interface will be familiar to Office app users, with the commands on the ribbon on the top, and the main edit window, and view & page navigation below. The key addition is the “Add shapes” pane on the left. Here you can choose the from the preset shape families or add shape families by clicking the + on the far left. All commands on the File, Home, Insert & Review tabs are also in PowerPoint, but I’ll call out some differences on other tabs later in this post. Although you will see “Open in Desktop App”, you wont be able to use that unless you have a paid tier of Microsoft Visio (plan 2). Sharing & commenting options work as in other apps.
Add shapes fast
Where Visio really shines is in how easy it is to add shapes via “quick shapes” & type text inside shapes & lines as shown in this gif.
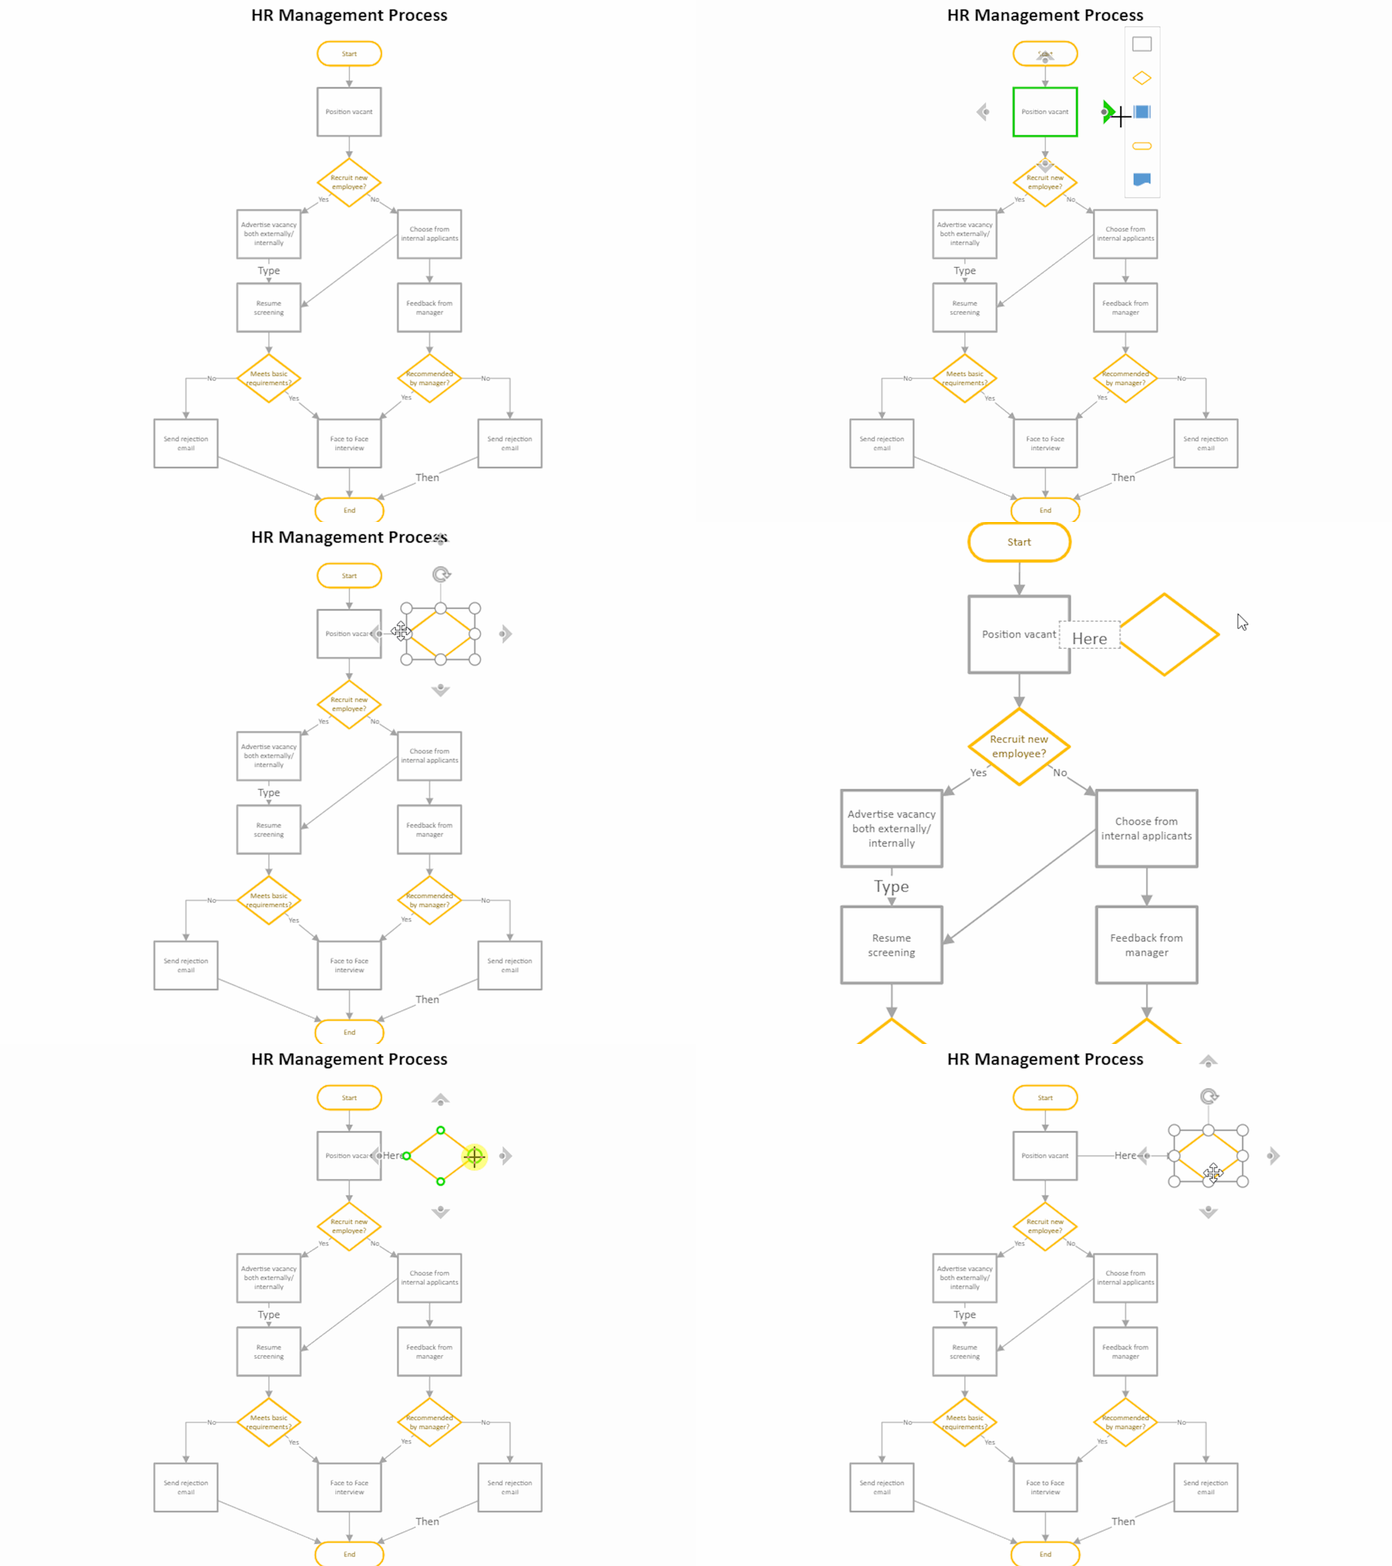
Quick Shapes is the pop up of shape suggestions when you click a shape then hover over the arrow in a direction as shown, choose one and you will get a shape & a connector between the current & new shapes. The suggested shapes change depending on which shape families are showing in the “Add shapes” pane on the left, meaning if you’re working with flowchart shapes it’ll show you those as quick shapes but if you’re working with Venn shapes, you’ll see those as quick shapes. Note you can disable the quick shapes from the View tab.

You can also add shapes from the left-hand pane itself, the Home or Insert tab (as per PowerPoint).
After you’ve added your shapes, click any shape or line to enter text in it. You can multiselect many shapes by clicking & dragging across (but note only shapes completely covered will be selected as in PowerPoint).
Adding icons
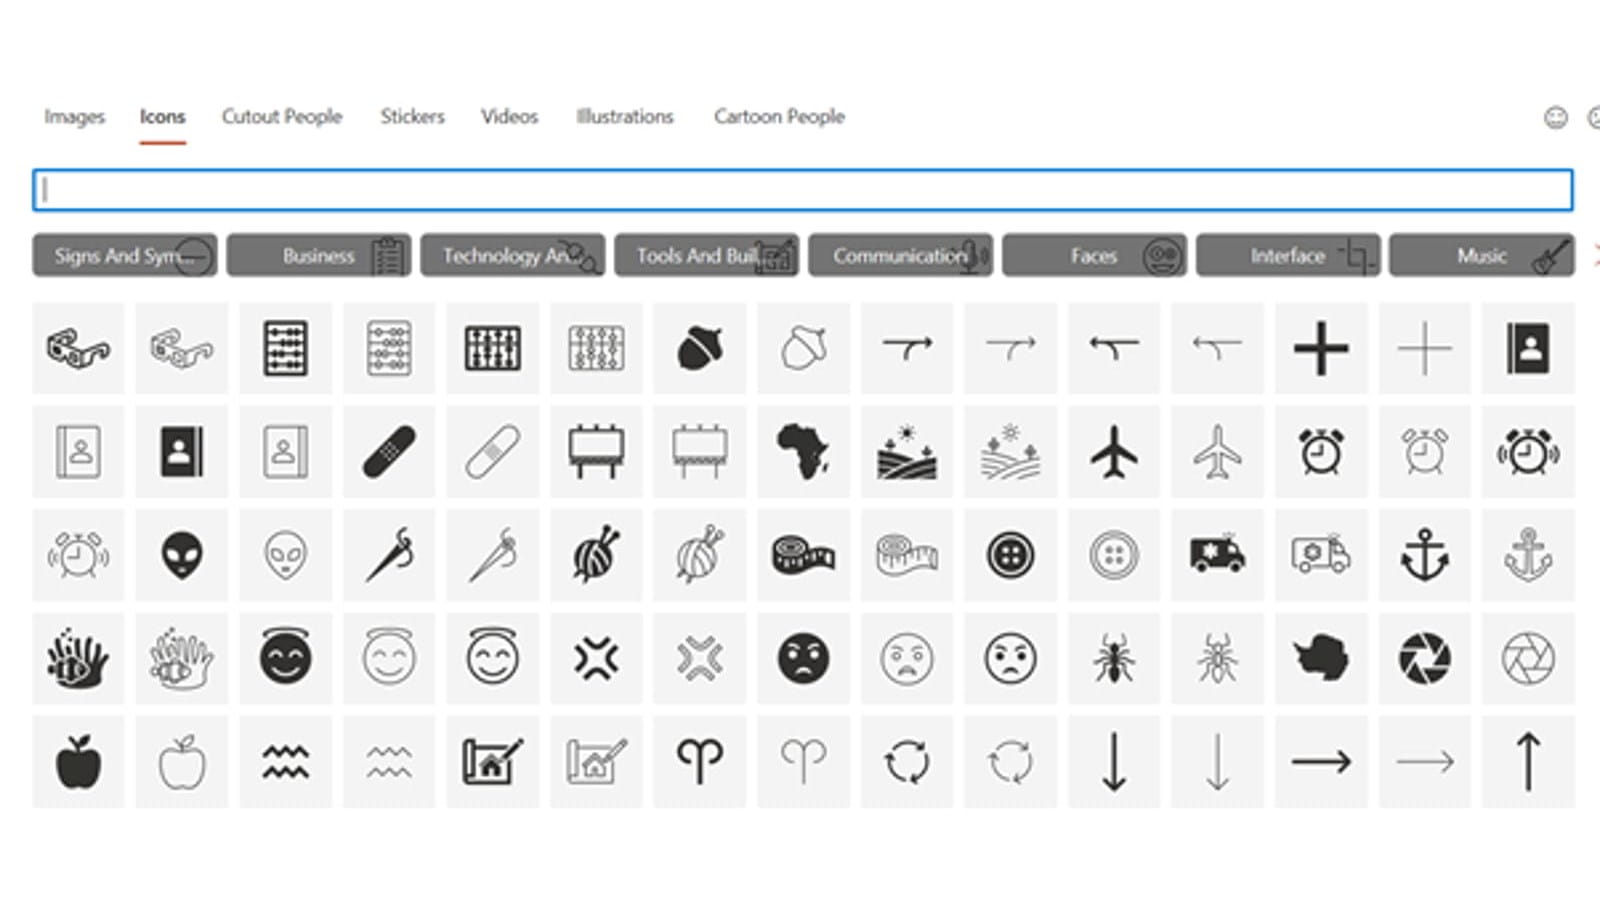
You can add certain icons via the shape galleries (in particular the symbols one), but options are limited with the free tier (the paid tier has over 250,000 shapes though), fortunately Office 365 has a large icon library with 1000’s to choose from. Although the Insert tab has Stock Photos, icons are not an option on Visio’s free tier, but you can export icons from PowerPoint (or 3rd party vendors like Noun project) then import as a picture into Visio. In PowerPoint, click Insert > Icons, search for what you need then re-colour if needed, and right click > Save as picture.
Arranging shapes
The beauty of Visio is that it usually arranges shapes for you however if you want to customise every shape & line you can do that just like you would in PowerPoint, and therefore the arrangement options are similar. In particular I like the align tools, but the distribute, grouping & send back/bring to front are also available
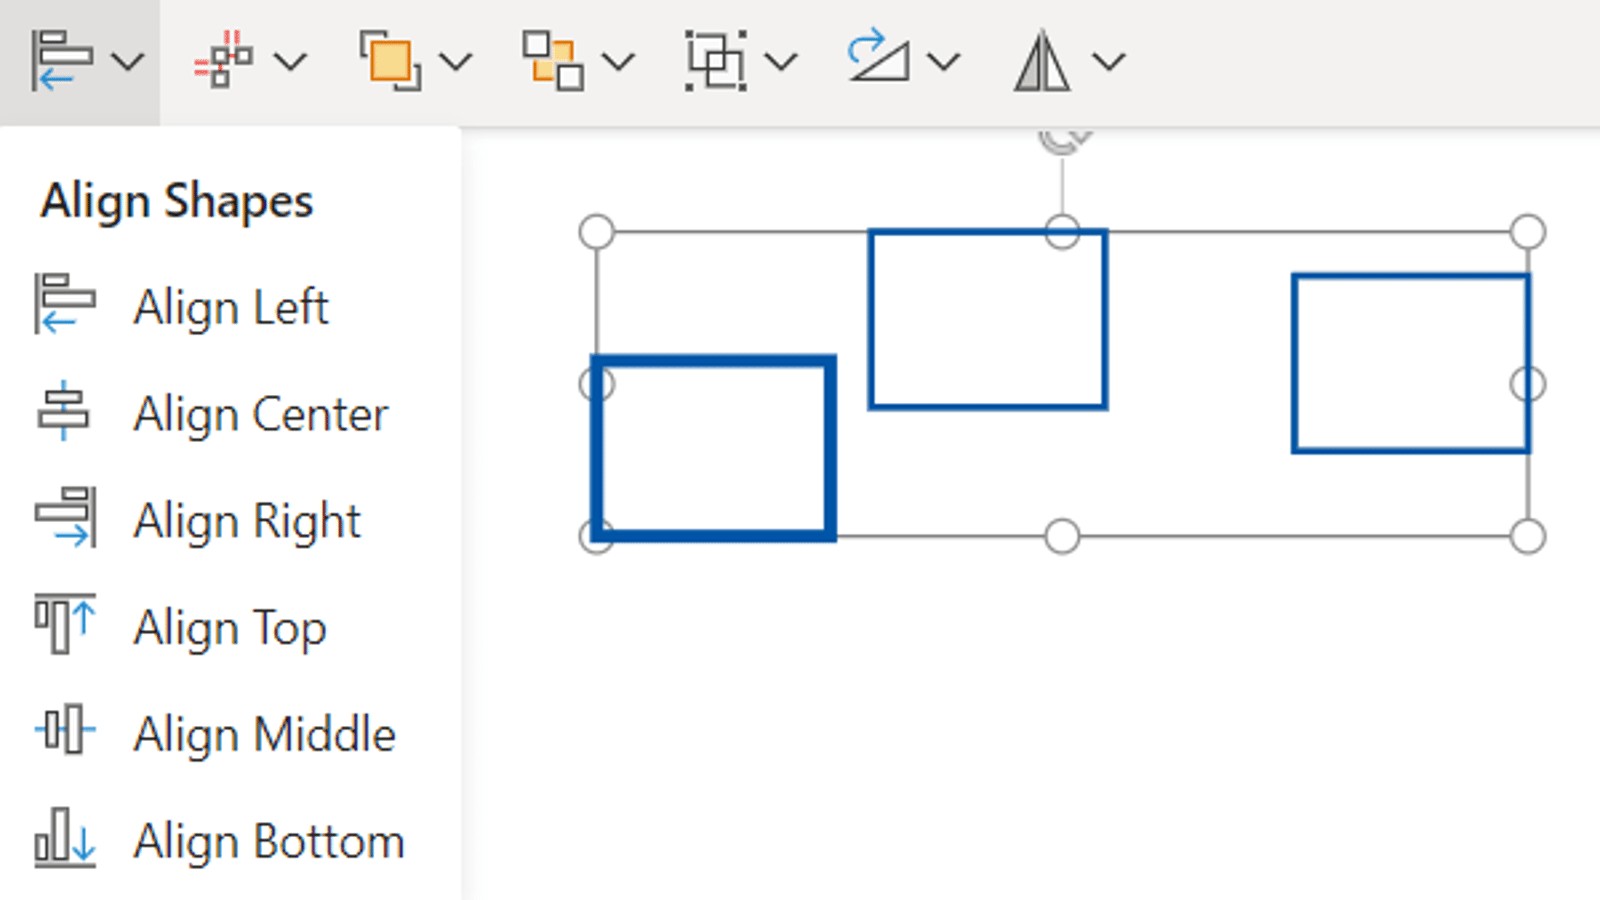
Re-organise the diagram as a whole
The Design tab has two Visio only options, diagram layout & connectors, both allow you to change the diagram as a whole. You can also edit your canvas size, colours & theme from this tab (as with PowerPoint).
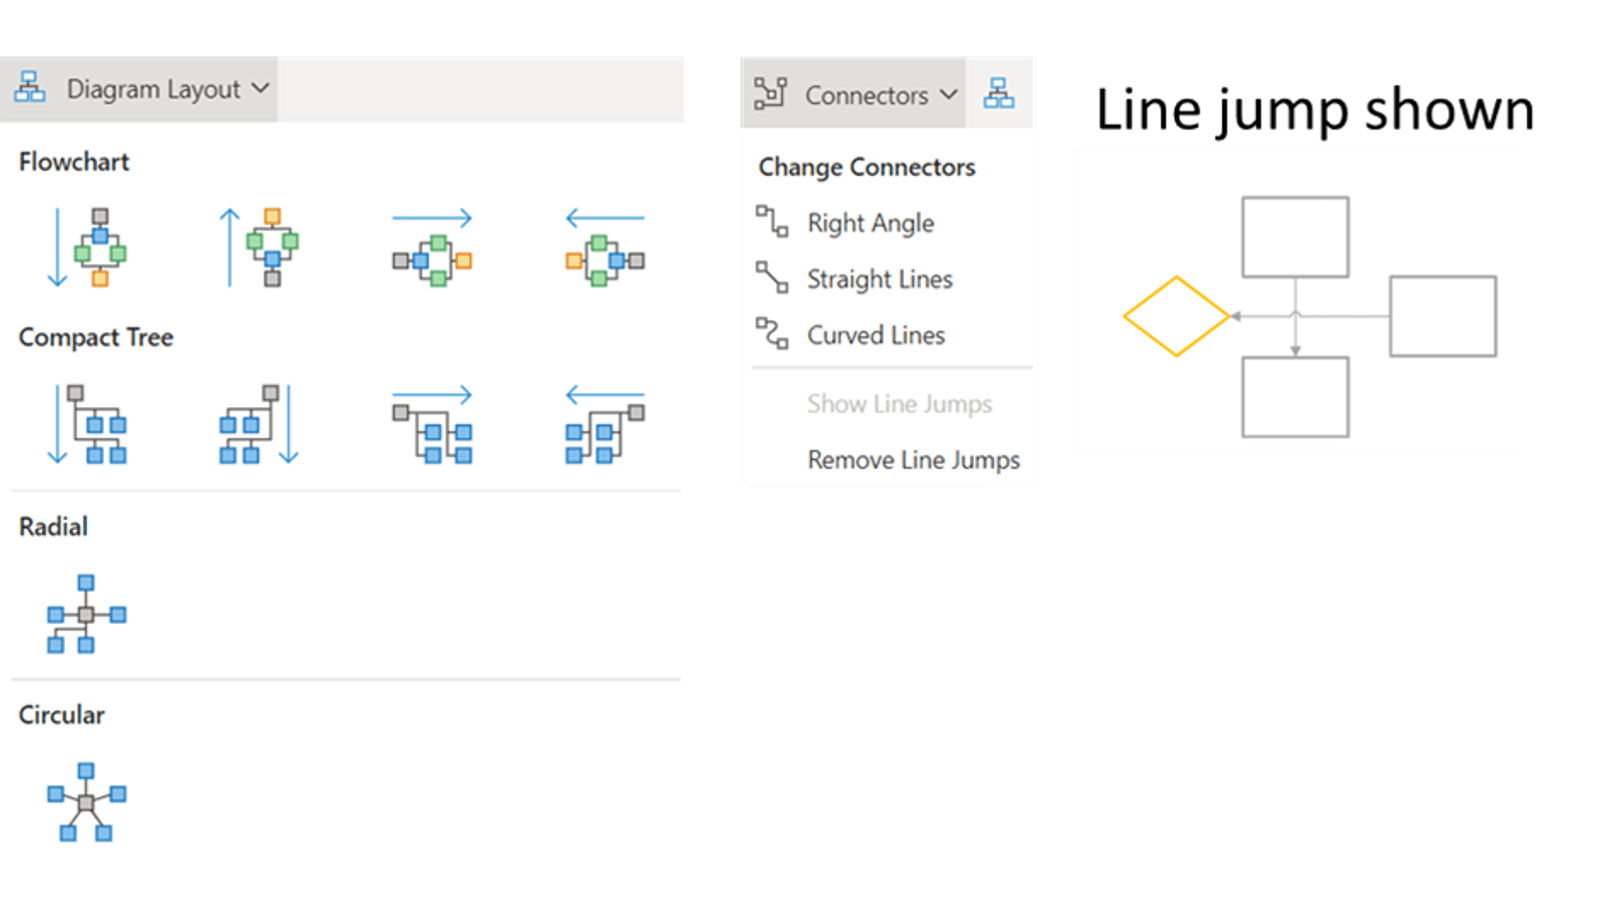
You can choose the connector style and managing line jumps. If there are overlaps and “Show line jumps” is enabled then there will be a circular jump to clearly identify the overlap as shown.
You can also drag shapes across the page breaks and that will resize across multiple pages. Note this is different than adding pages on the bottom (which refers to different diagrams). Personally I rarely use pages since I normaly create diagrams to export as image files. I also tend to switch off the page breaks from the View tab.
Venn Diagrams
Creating Venn’s on PowerPoint is a poor experience. Regardless of whether you choose to add shapes manually or use SmartArt, you cannot write text in the overlapping segments without extra textboxes. Visio makes every overlapping segment easily editable, you can get to it by starting with a Venn diagram template or inserting shapes from the Venn Diagram Shapes gallery, but choose the colourful ones. Choose the option with many shapes, usually they will be more colourful (yellows, reds or green colours here) to indicate they will be editable. If you create the diagram shape by shape, then you will not be able to write in the overlap segments.
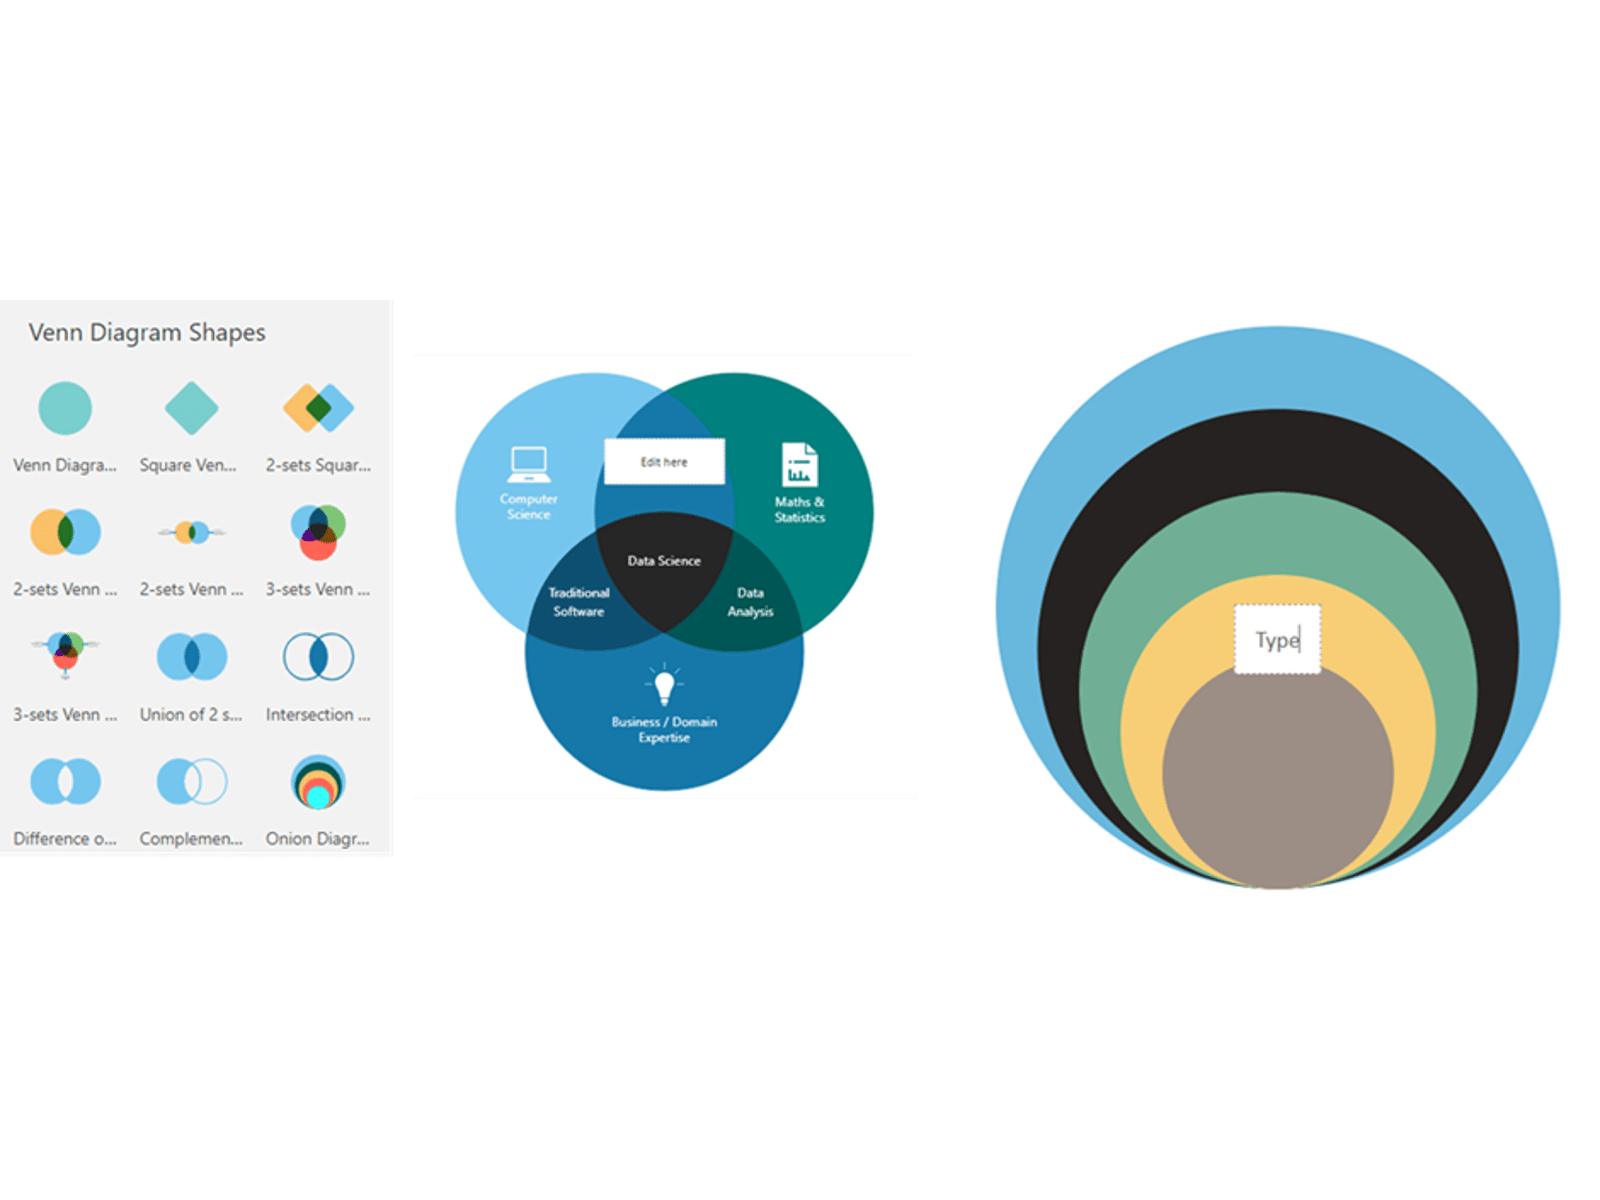
Exporting your diagram
Click File > Save As > Download as image, then I recommend these settings:
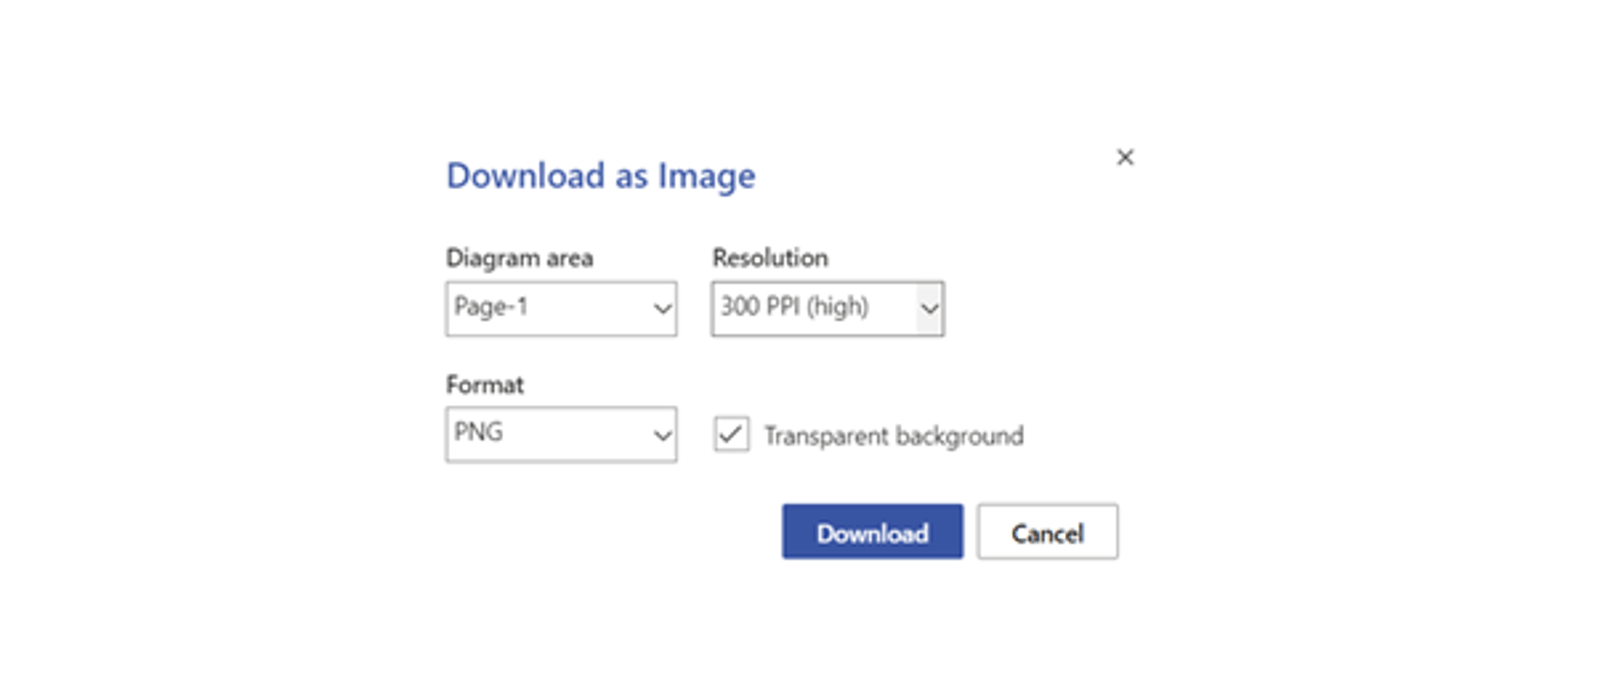
More advanced types of export are available for Visio Desktop subscribers including export as svg file, view across multiple PowerPoint slides, selective export to Word and alternatively you can use Visio’s Excel data visualizer to edit shapes in Excel.
Templates
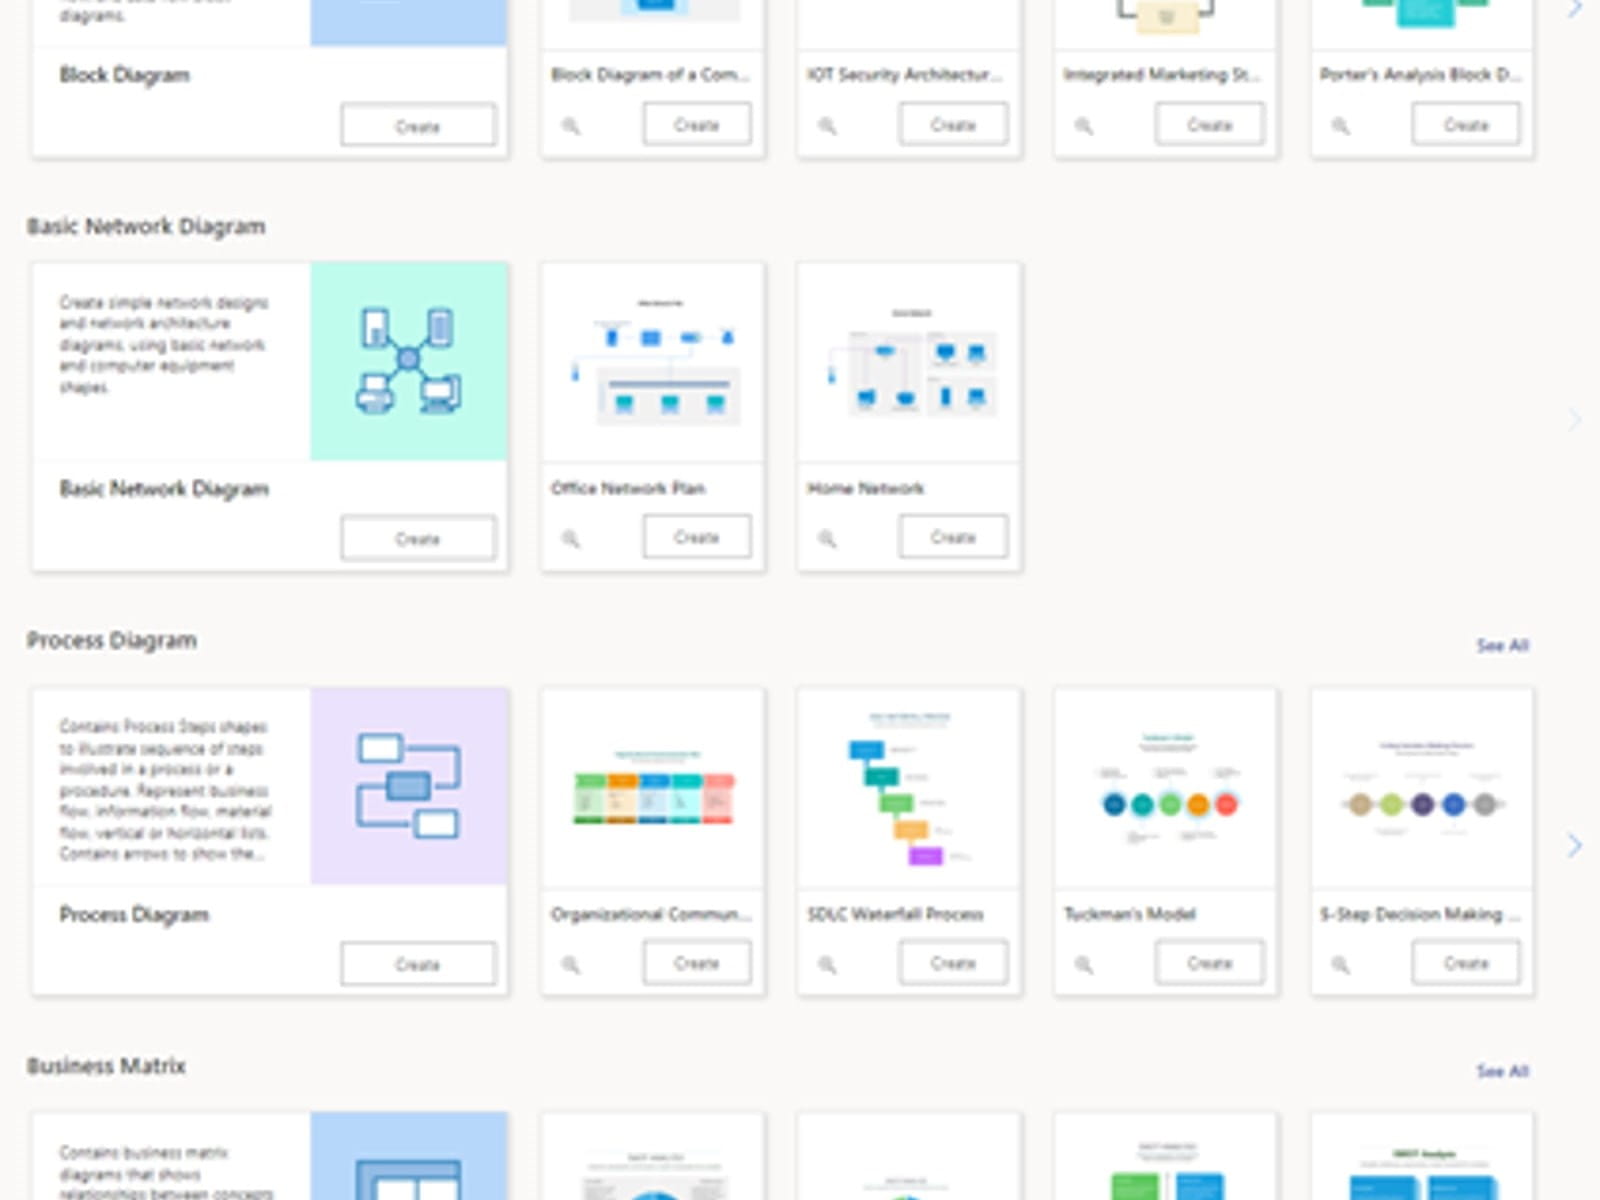
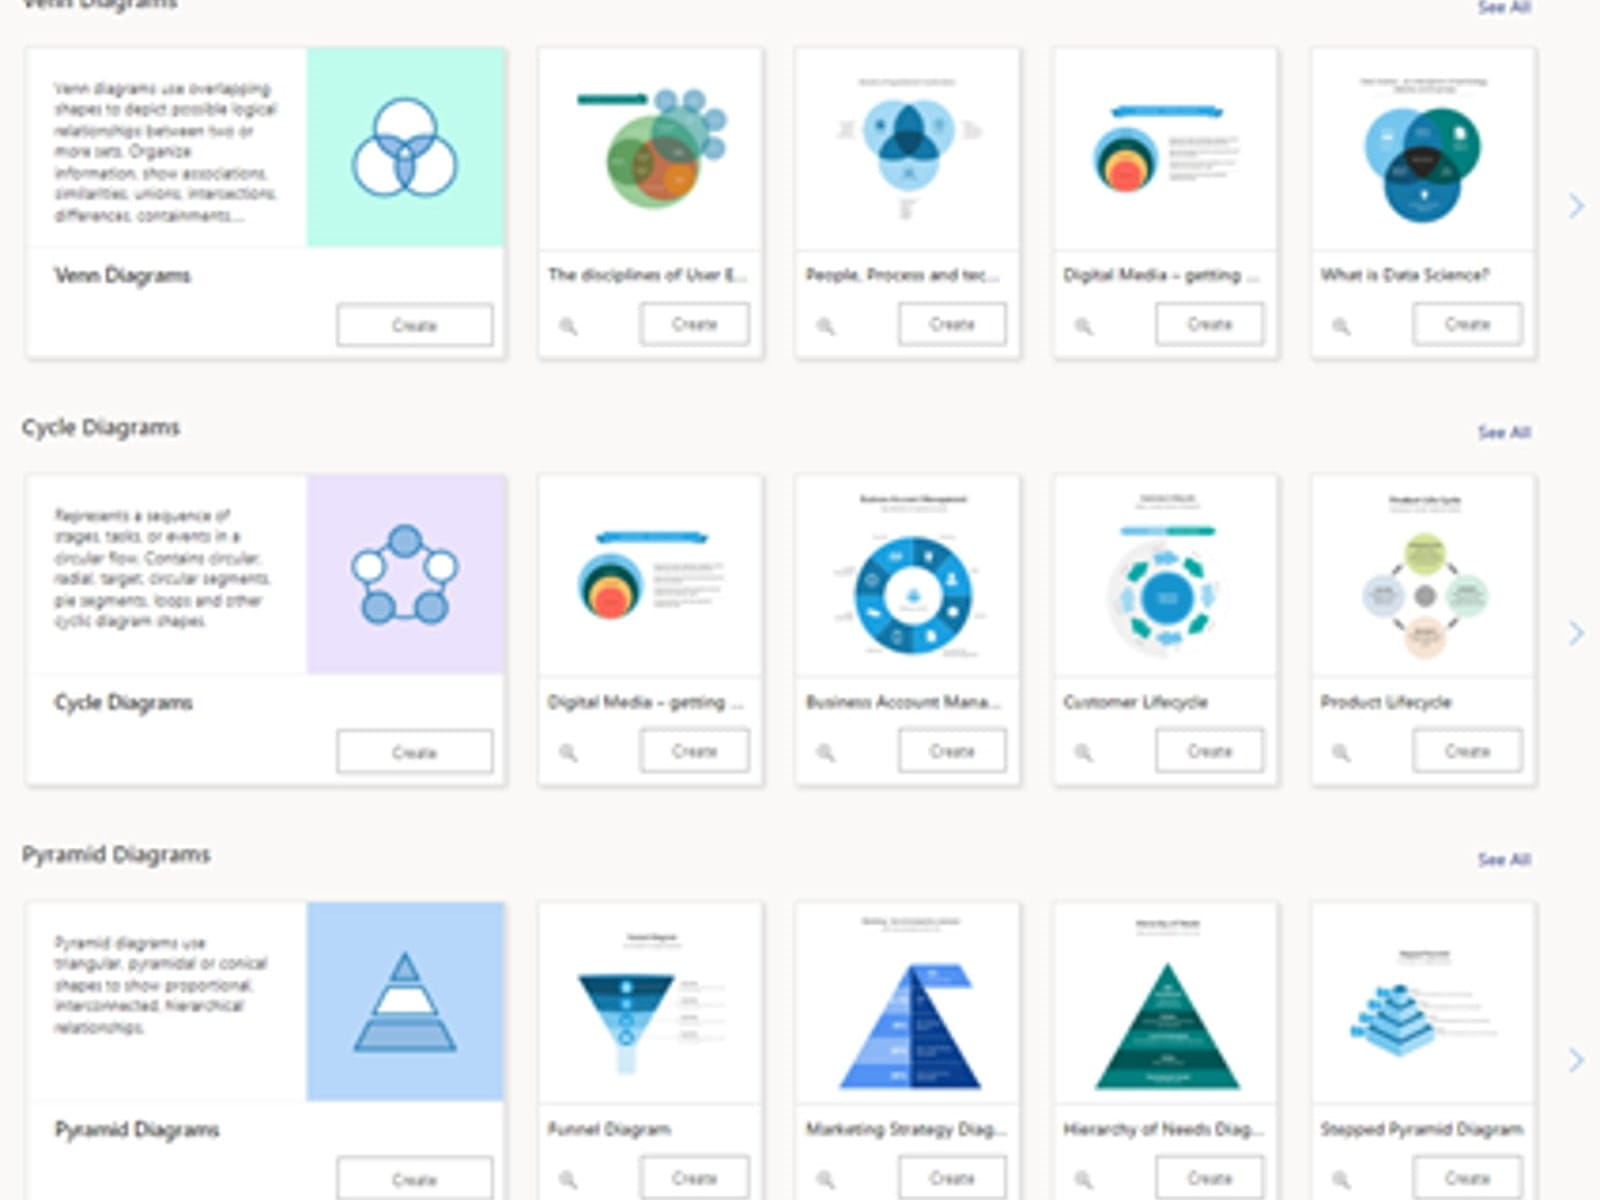
Prebuilt diagrams could be manipulated instead of starting from scratch. Click “More Templates” to view templates by group, here, the core templates are grouped together, click “See all” to expand into more in each group.
Archive and Knowledge Base
This archive of Excel Community content from the ION platform will allow you to read the content of the articles but the functionality on the pages is limited. The ION search box, tags and navigation buttons on the archived pages will not work. Pages will load more slowly than a live website. You may be able to follow links to other articles but if this does not work, please return to the archive search. You can also search our Knowledge Base for access to all articles, new and archived, organised by topic.
