
An imminent Excel enhancement will allow you to include Data Types and images in your PivotTables. Is this your chance to build PivotTables containing employee photos and product pictures?
Introduction
Last month we looked at Excel Data Types, including the ability to create your own ‘Organisation’ Data Types using Power BI. Since then, Microsoft have released another Data Type enhancement to the Insider Channel: the ability to use Data Types and images as part of a PivotTable.
As we saw in the previous article, if a cell, or a range of cells, contains certain types of text entry, those cells can be selected, and clicking on the appropriate item from the Data Types gallery in the Data Types group of the Data Ribbon tab, will convert the text entries into Data Types. In this example, we have entered the names of three countries in an Excel Table, we have then selected those three cells and clicked on the Geography Data Type. Once the cells have been converted to a Data Type, additional columns can be added to the Table by clicking on the Add Column icon and choosing the required property:
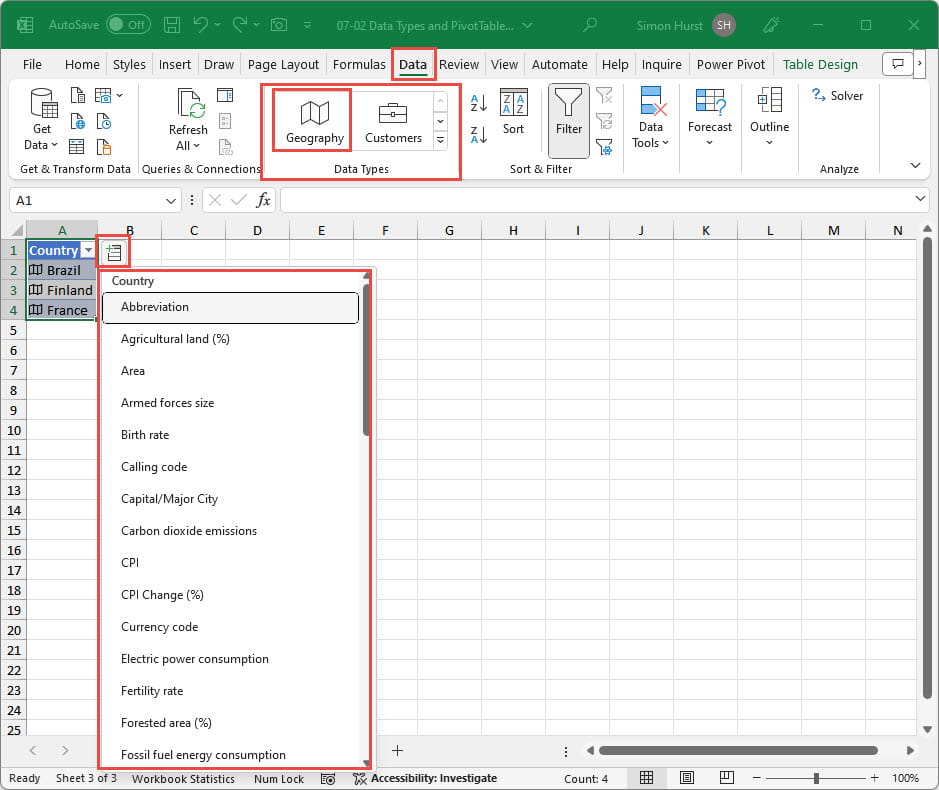
As you can see, the information isn’t necessarily that up to date…
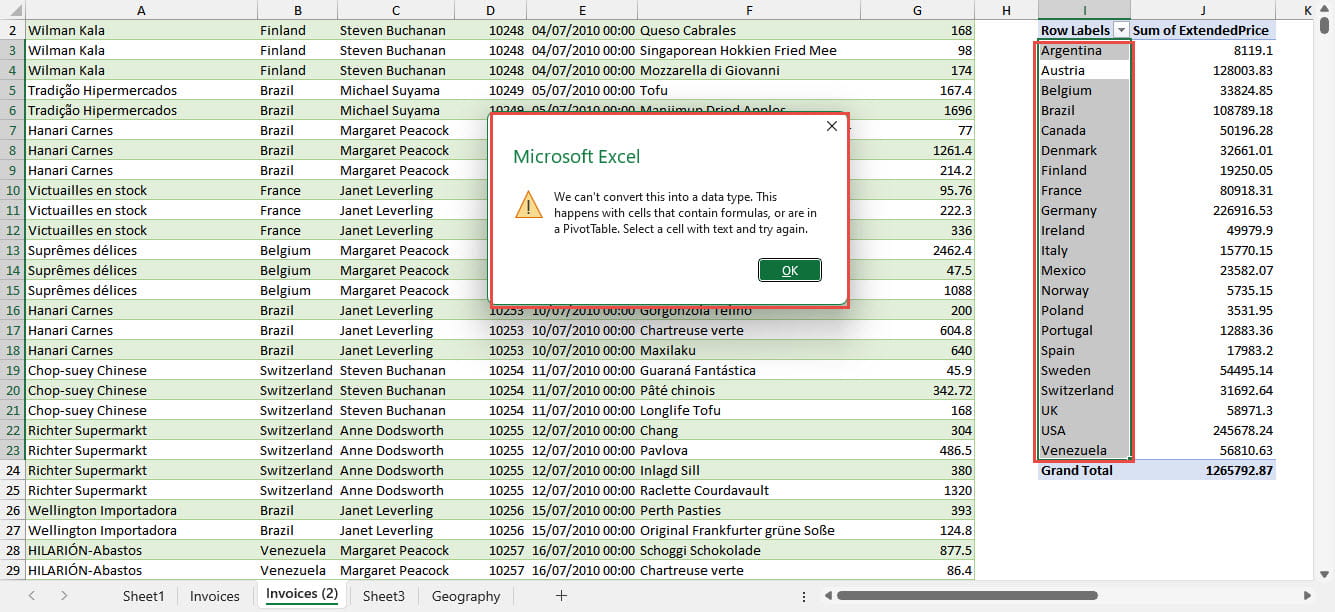
We have seen how this works with simple text cells but if those cells are part of a PivotTable, they cannot be converted to Data Types. In this example, we have created a simple PivotTable based on data that includes a Country column. If we select the Country values in the PivotTable and click on the Geography Data Type as we did above, Excel will display an error message saying that it cannot convert the selected cells into a data type as they are in a PivotTable:
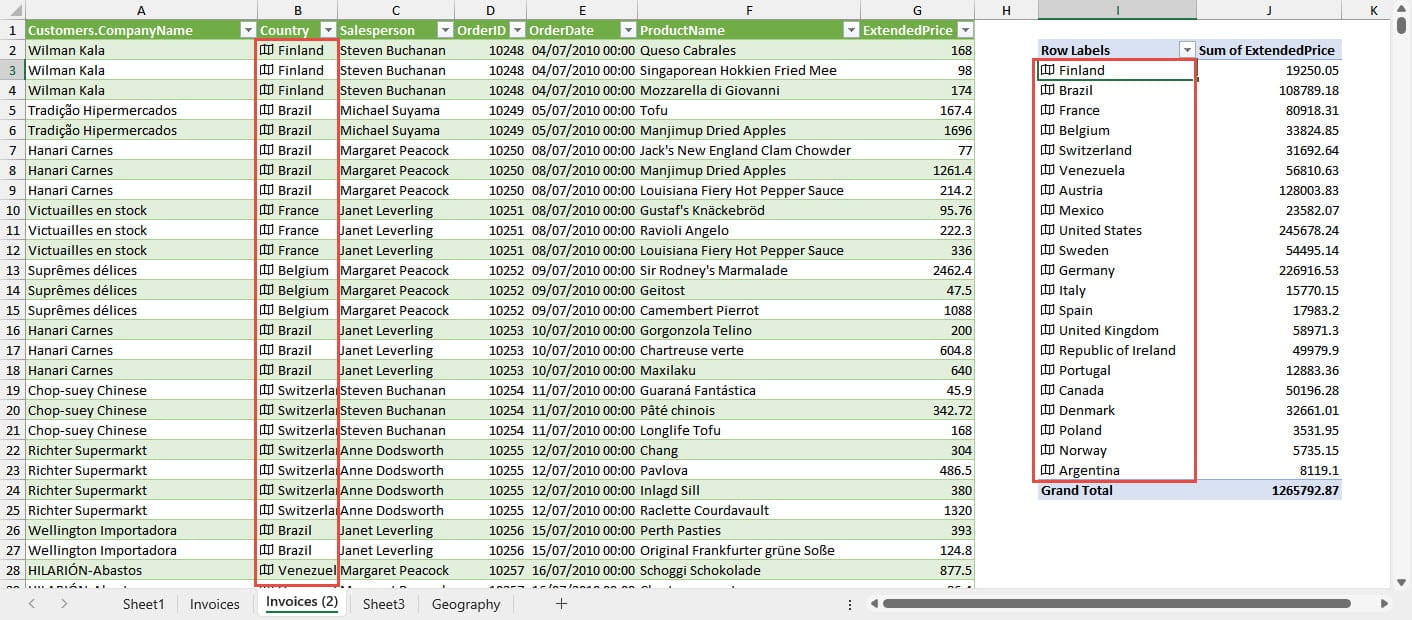
The imminent enhancement gives us a way to create a PivotTable that does include Data Types. We can select our Country column data cells in the source data and convert them to the Geography Data Type. We can refresh our PivotTable, and the PivotTable Country column will then contain Data Types:
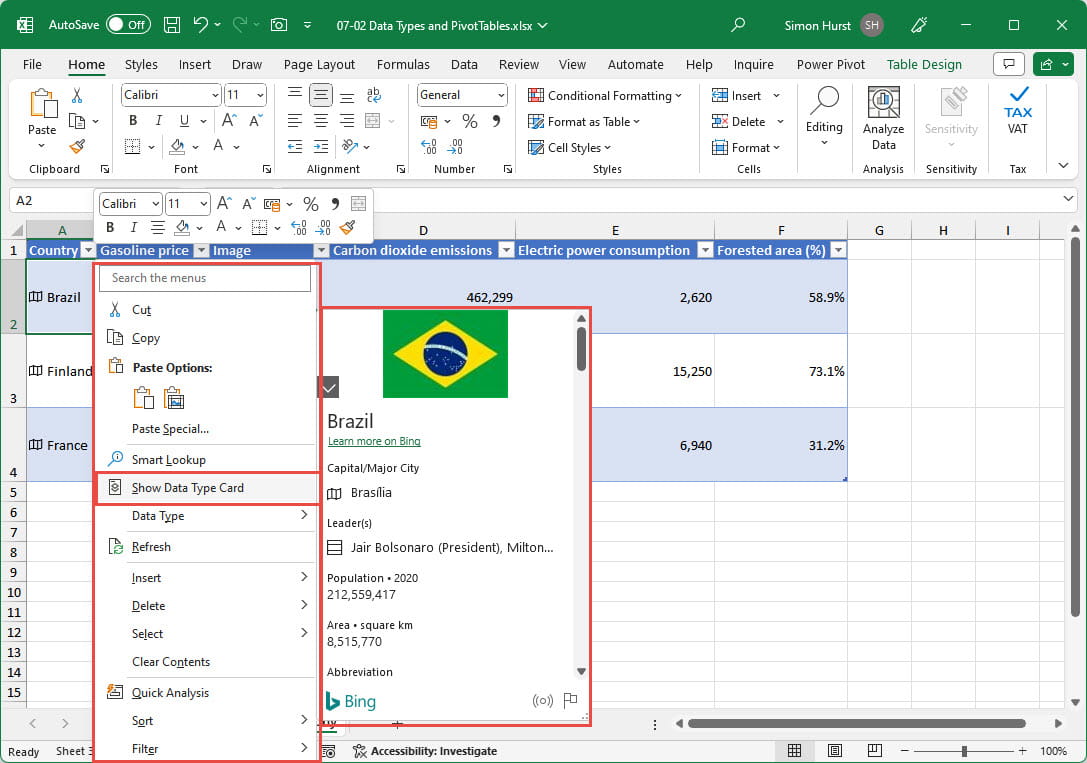
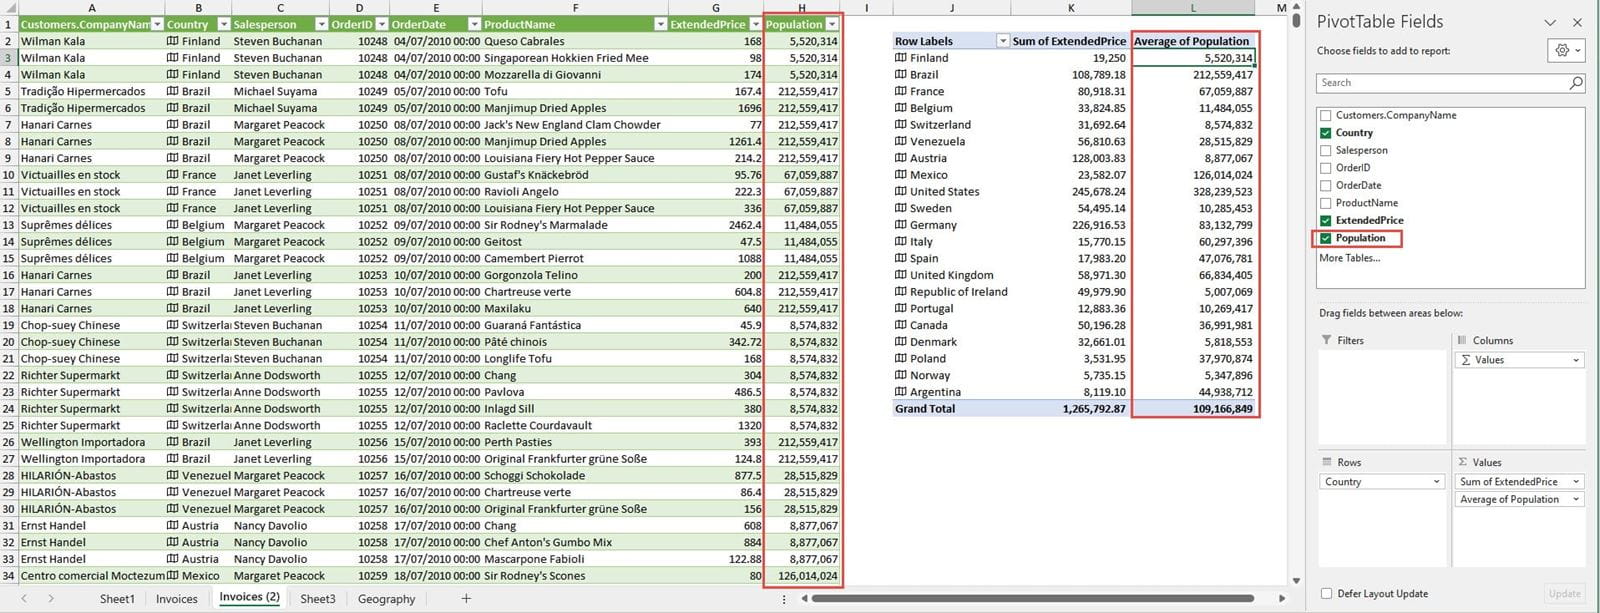
Within the PivotTable, the Data Type cells retain some of the interactivity of a ‘normal’ Data Type cell. You can right-click on the cell within the PivotTable and choose to Show Data Type Card. However, you can’t add any property columns directly in the PivotTable. Instead, you would need to add columns to the source data and then refresh the PivotTable to make the additional columns available for inclusion. Here, we have added the Population property column to our source data and then added it to the Values area of our refreshed PivotTable as an Average:
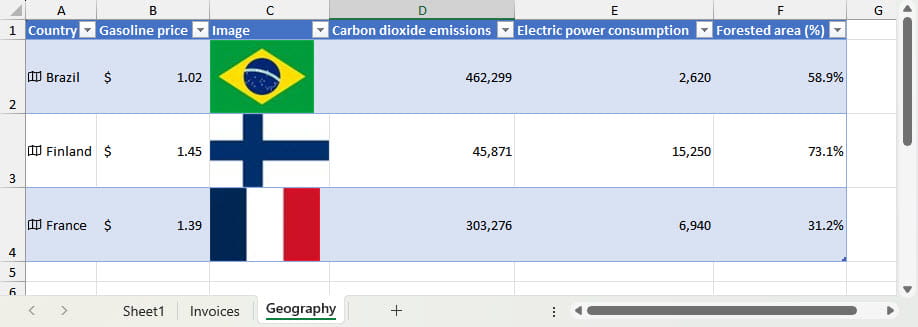
The other PivotTable enhancement is the ability to display images as part of the PivotTable. Here, we have added an Image column to our source data Table and then refreshed the PivotTable and added the Image field to the Row area:
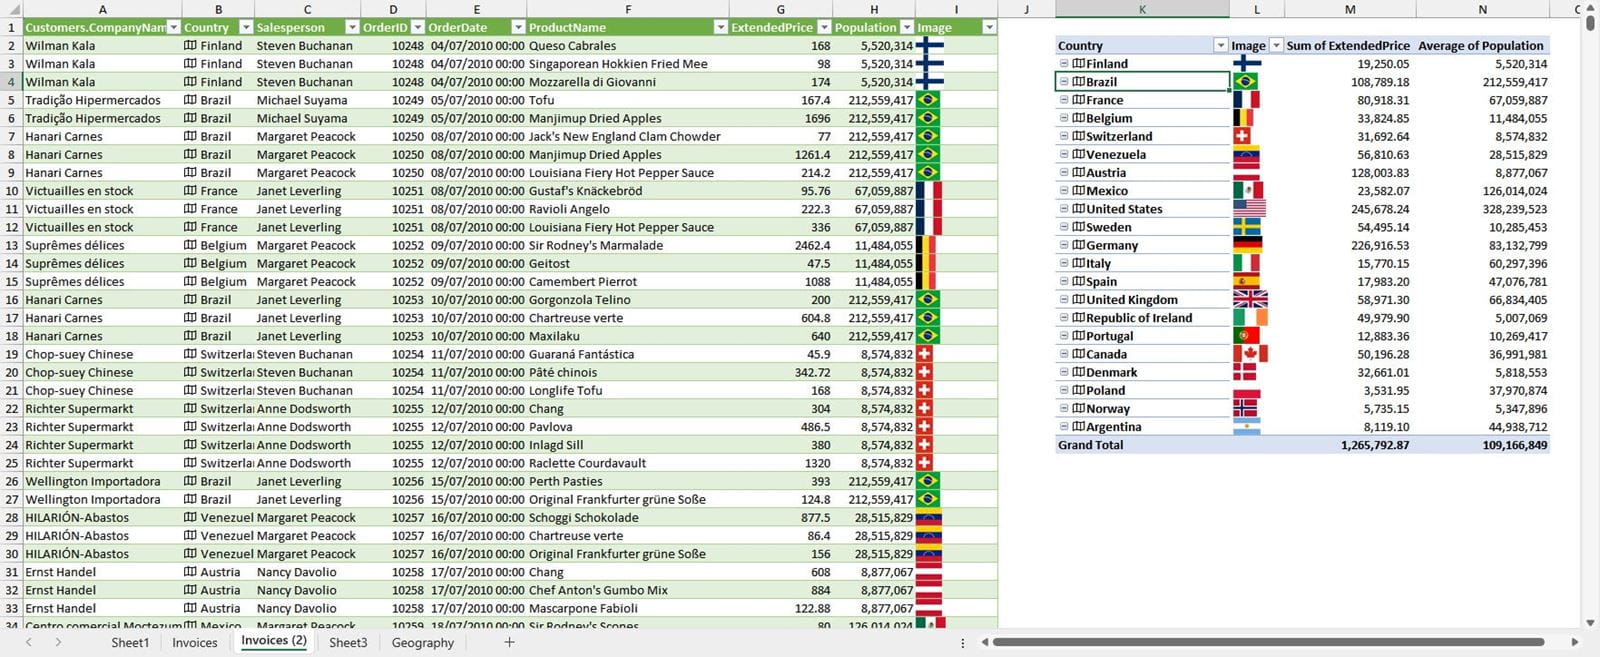
At the time of writing, this didn’t work perfectly first time. Not all the images appeared in the Image column of the Data Source, leading to some #VALUE! entries in the PivotTable. Copying the formula down from the top data cell to all the other cells in the Image column, and then refreshing the PivotTable, seemed to solve the issue. Also, from the time it took to display the images in each of the 2,155 rows of the data source, using images could well have a significant performance impact on very large data sets.
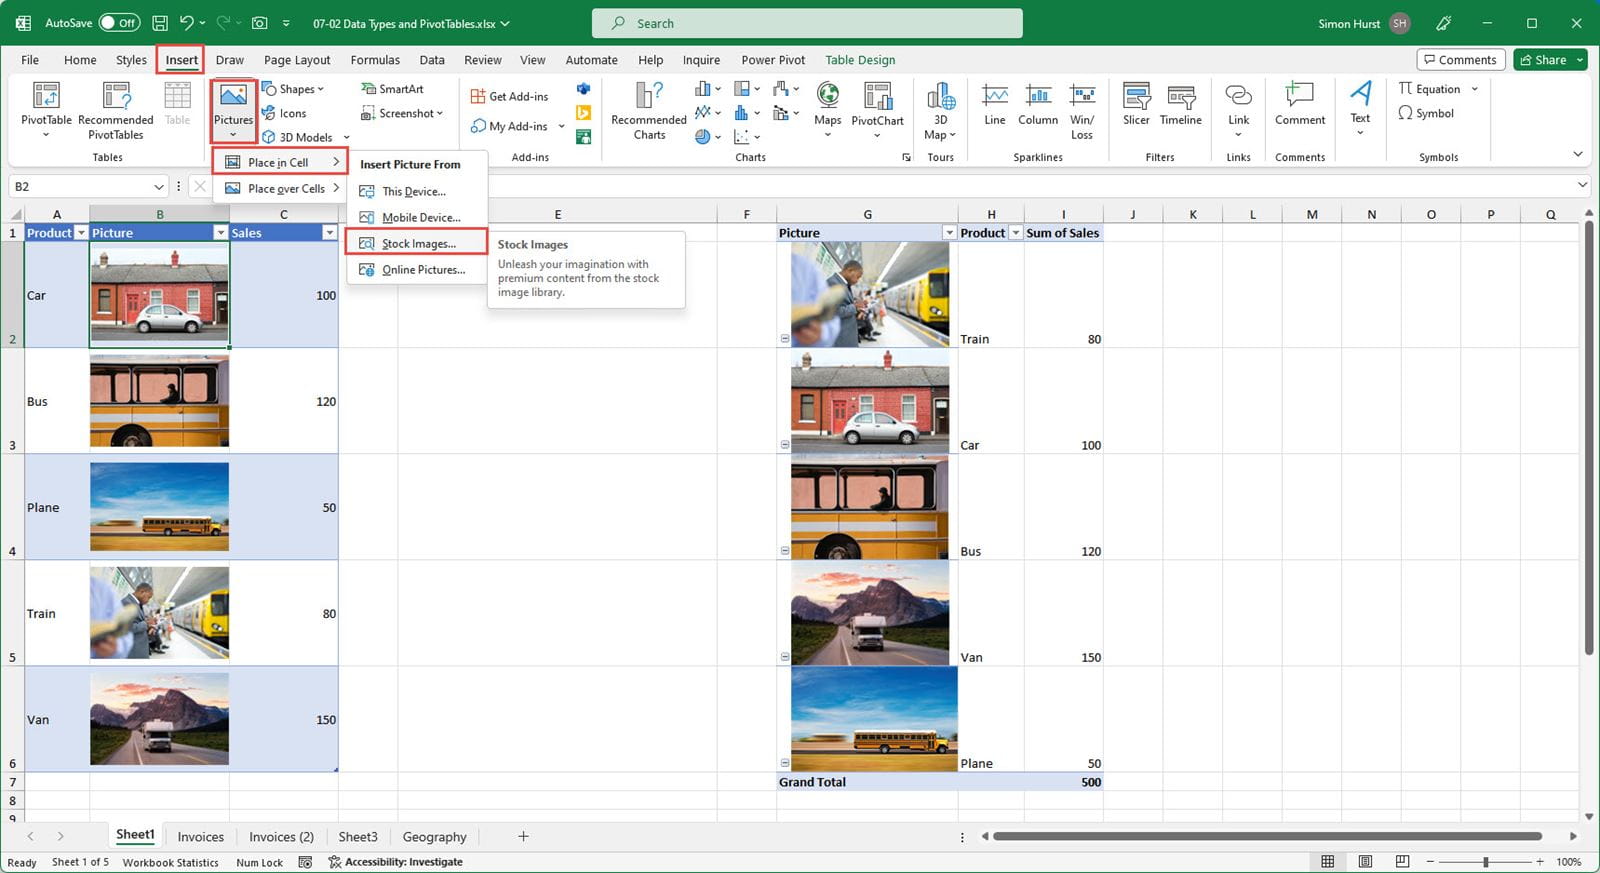
The display of images in a PivotTable is not limited to images created by using a Data Type. In the Illustrations group of the Insert Ribbon tab, the Picture command now includes an option to place an image into a cell as well as the previous ‘floating’ object. If we have a source table that includes images entered into cells in this way, when we base a PivotTable on it, the images will also be displayed in the PivotTable:
Remembering that this feature is not yet in the general release version of Excel so things might change, the use of images seems only to work with PivotTables that are not based on the Data Model. Where the Data Model is used, the images are replaced by their descriptions as was the case before the introduction of the enhancement.
Excel Features Flyer
One of the quickest ways to check to see if you should have access to any enhancement in your version of Excel is to go to the Excel Features Flyer:
https://onedrive.live.com/View.aspx?resid=E07B6F5DD91EC58B!261&authkey=!AMNbD8E1w2sfb9c
You can check the version you have installed by going to the File Ribbon tab and clicking on Account and looking in the About Excel section.
Archive and Knowledge Base
This archive of Excel Community content from the ION platform will allow you to read the content of the articles but the functionality on the pages is limited. The ION search box, tags and navigation buttons on the archived pages will not work. Pages will load more slowly than a live website. You may be able to follow links to other articles but if this does not work, please return to the archive search. You can also search our Knowledge Base for access to all articles, new and archived, organised by topic.