
In this final article, we will look at probability and whilst people turn to the finance function for accurate answers, it may not always be possible to provide them.
Take for example supply chain – how many items should we have ready for tomorrow’s sales?
To answer this, we can explore past data and understand the probability of demand. Take the example we started in blog 1, with a corner shop and their milk sales. We can calculate the mean and standard deviation of the data over the month:
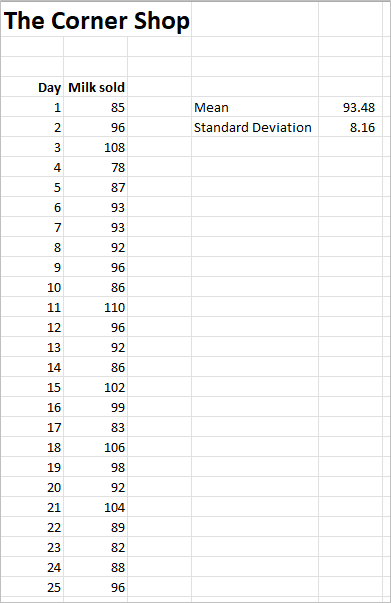
The mean is calculated using the =AVERAGE(range) function as explained in Blog 1. The Standard Deviation is calculated using the function =STDEV.P(range). There are two functions =STDEV.P is for when the data represents the whole population and =STDEV.S when the data represents a sample from the population (=STDEVP is the same as =STDEV.P and =STDEV is the same as =STDEV.S).
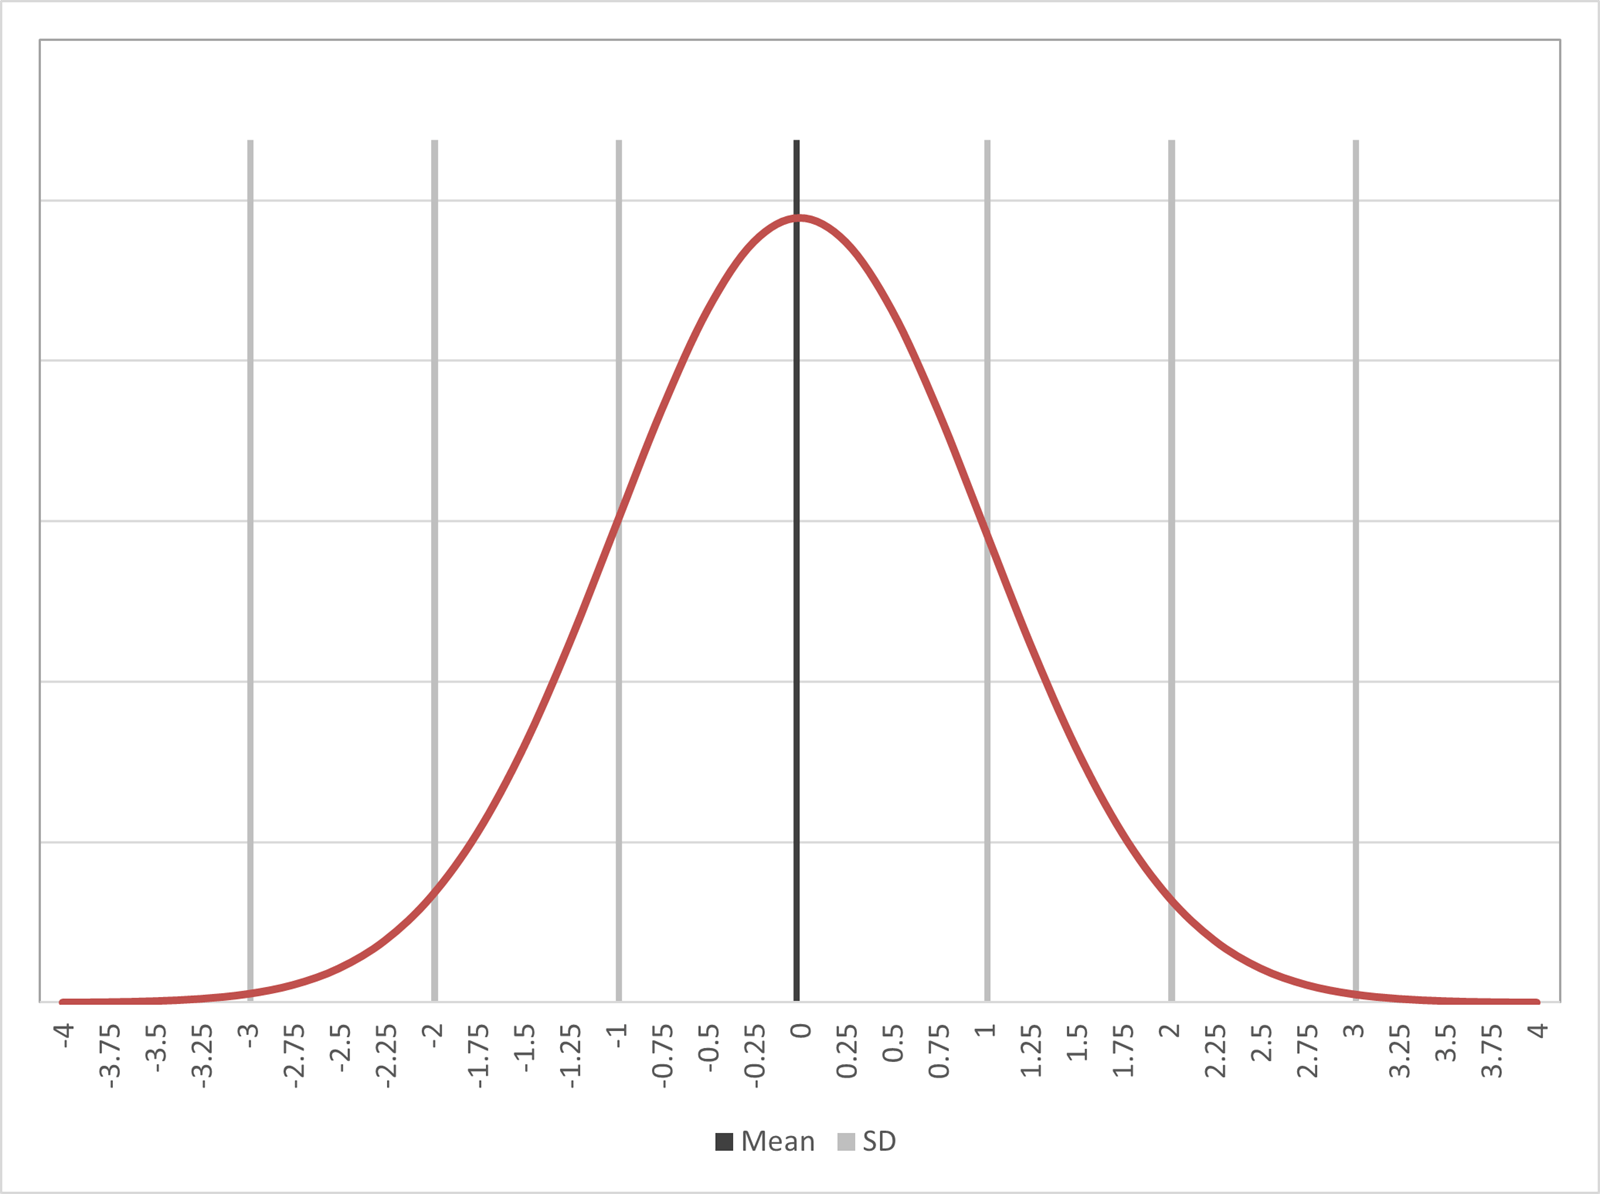
Probabilities on a normal distribution curve are as follows:
1 standard deviation away from the mean represents 68.43% of the population. 2 standard deviations is 95.5%. 3 standard deviations is 99.7% and 4 standard deviations is 99.9%
Using this information, we can create a service level inventory plan. If we hold the mean plus two standard deviations : 93.48 + (2 * 8.16) = 110 units. Then we should be able to meet all the demand for days when volume is below the mean and 95.5% of the days when demand is above the mean: 50% + (95.5% /2) = 97.75% of all demand.
365 * 97.75% = statistically there will be 8 days a year that we run out of stock.
With milk sales this level of inventory may lead to wastage on days when there are unsold items. We might be more profitable only holding enough for say 90% of demand and increasing the number of days when we are unable to supply to the last few potential customers each day. The risk here is that if we are out of stock on too many occasions customers may choose to shop elsewhere.
We can create a service level table that plots demand and the number of standard deviations from the mean.
| Service Level Requirement % |
Service Level Factor Standard Deviations from Mean Demand |
|---|---|
| 50 | 0.00 |
| 75 | 0.67 |
| 85 | 1.04 |
| 90 | 1.28 |
| 95 | 1.64 |
| 96 | 1.75 |
| 97 | 1.88 |
| 98 | 2.05 |
| 99 | 2.33 |
| 99.5 | 2.57 |
| 99.9 | 3.09 |
For example, for 95% service level you need to hold 1.64 standard deviations above the mean : 93.48 + (1.64 * 8.16) = 107 units.
You will see even in our sample there would be two days where the product sold out.
Of course, with milk its shelf life allows it to be held a few days before being disposed and thus holding small variances can be easily absorbed and reduced from the next day’s supply order.
Be careful analysing data this way as when looking back at historic data you will never know the actual demand on days when you sold out – how many more could you have sold if you had the stock?
Determining Probabilities
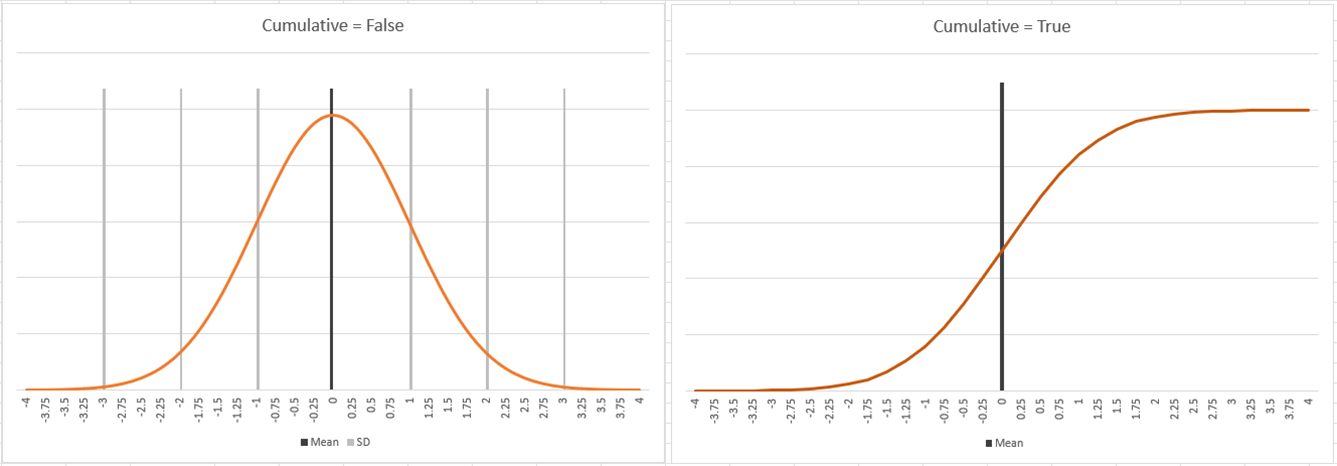
To draw the normal distribution curve, you can use the function =NORM.DIST or NORMDIST. Both have the following attributes (value, mean, standard deviation, cumulative). The value returned is the probability of that value as a percentage.
The cumulative factor can display the chart as a bell shape curve (when set to false) or S shaped curve (when set to true). The latter is more relevant for inventory.
The first part of the table to generate the bell-shaped curve is as follows:
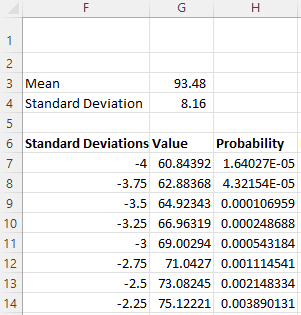
The value in cell H7 is: =NORM.DIST(G7,$G$3,$G$64,FALSE)
Monte Carlo Analysis
Normal distributions can also be used for business cases. To gain confidence in a business case valuation we apply sensitivity analysis, traditionally we look +/-10% on revenue and costs, perhaps timing delays and costs overruns for the initial investment.
How about compiling multiple valuations and then understanding the probability of success. This is known as a Monte Carlo Analysis. To create this, you need to construct a business model that uses ranges of assumptions rather than single point values. By applying the random number generator in Excel =RAND() a value in each of the assumption ranges can be generated. Every time F9 is pressed (recalculate) a new set of assumptions is created. Capture 100 or more NPV results and then apply probability to determine an indicator of the risk of success.
e.g. customer numbers might be expected to fall in the range 250 to 350.
To find a random point within the range would be calculated as follows =250+(RAND()*(350-250)). There is a function called RANDBETWEEN(value,value), however it only works in Integers and thus does not work for percentage ranges.
NB for this to work any business case model must be built ‘Dynamically’ - which means that as any one assumption is changed the model will always yield a valid answer. To achieve this the assumptions are linked by ratios rather than having a hard value. For example, when customer numbers are flexed then the assumptions for items such as staff numbers are flexed as well. Instead of having an assumption of 14 staff to run the operation, staff numbers will be 1 person per 25 customers. This way, as the customer number is flexed, the staff number will flex proportionately making the range valuation values valid.
Series concludes
I hope this series has been helpful to you in using Excel for Maths and statistics for deeper data insights.
Archive and Knowledge Base
This archive of Excel Community content from the ION platform will allow you to read the content of the articles but the functionality on the pages is limited. The ION search box, tags and navigation buttons on the archived pages will not work. Pages will load more slowly than a live website. You may be able to follow links to other articles but if this does not work, please return to the archive search. You can also search our Knowledge Base for access to all articles, new and archived, organised by topic.