
An example would be in a business case/business plan for a product launch or roll out into a new market. In these situations, it is common to take a 5-to-10-year view of the market opportunity. The models are typically constructed with a constant growth rate over the time period that conveys a compelling reason to go ahead. However, these expectations can be far from convincing and particularly when compound growth rates are used. The later years can show an apparent market dominance with what appears to be little retaliatory action from competitors.
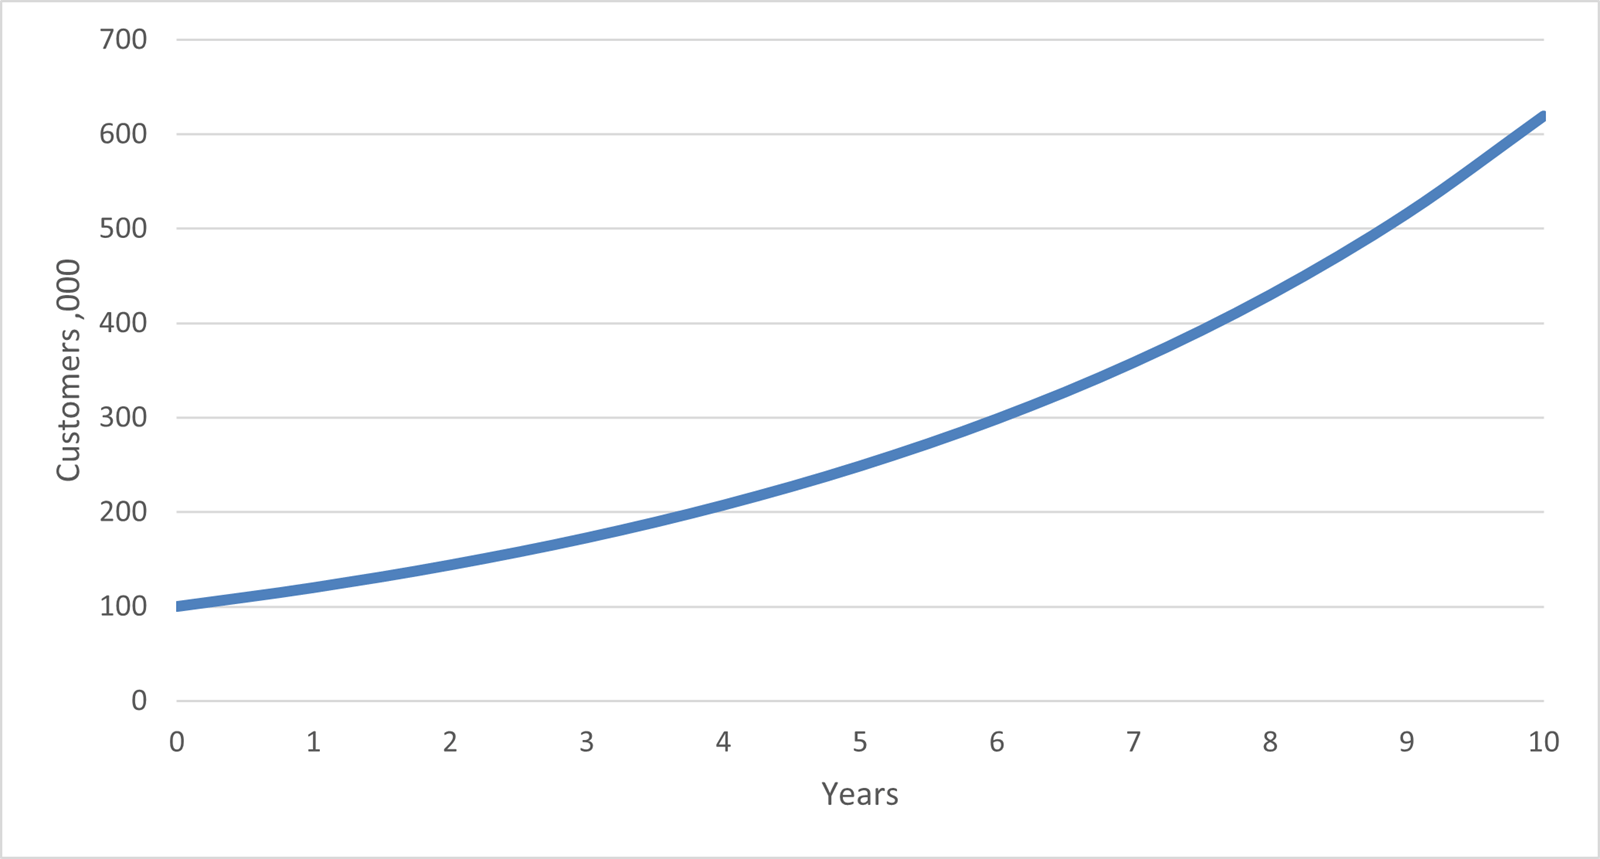
Take for example a 20% compound growth over 10 years.
The maths required is:
| Year | 0 | 1 | 2 | 3 | 4 | 5 | 6 | 7 | 8 | 9 | 10 |
|---|---|---|---|---|---|---|---|---|---|---|---|
| Customers | 100 | 120 | 144 | 173 |
207 | 249 | 299 | 358 | 430 | 516 | 619 |
Starting with 100 and each subsequent year being 1.2 (1 + growth rate) * the previous year.
The growth rate starts sensibly with small increments, but as the compounding effect kicks in, the later years are showing huge increases in volume. 50% of the total increase occurs in the last three years.
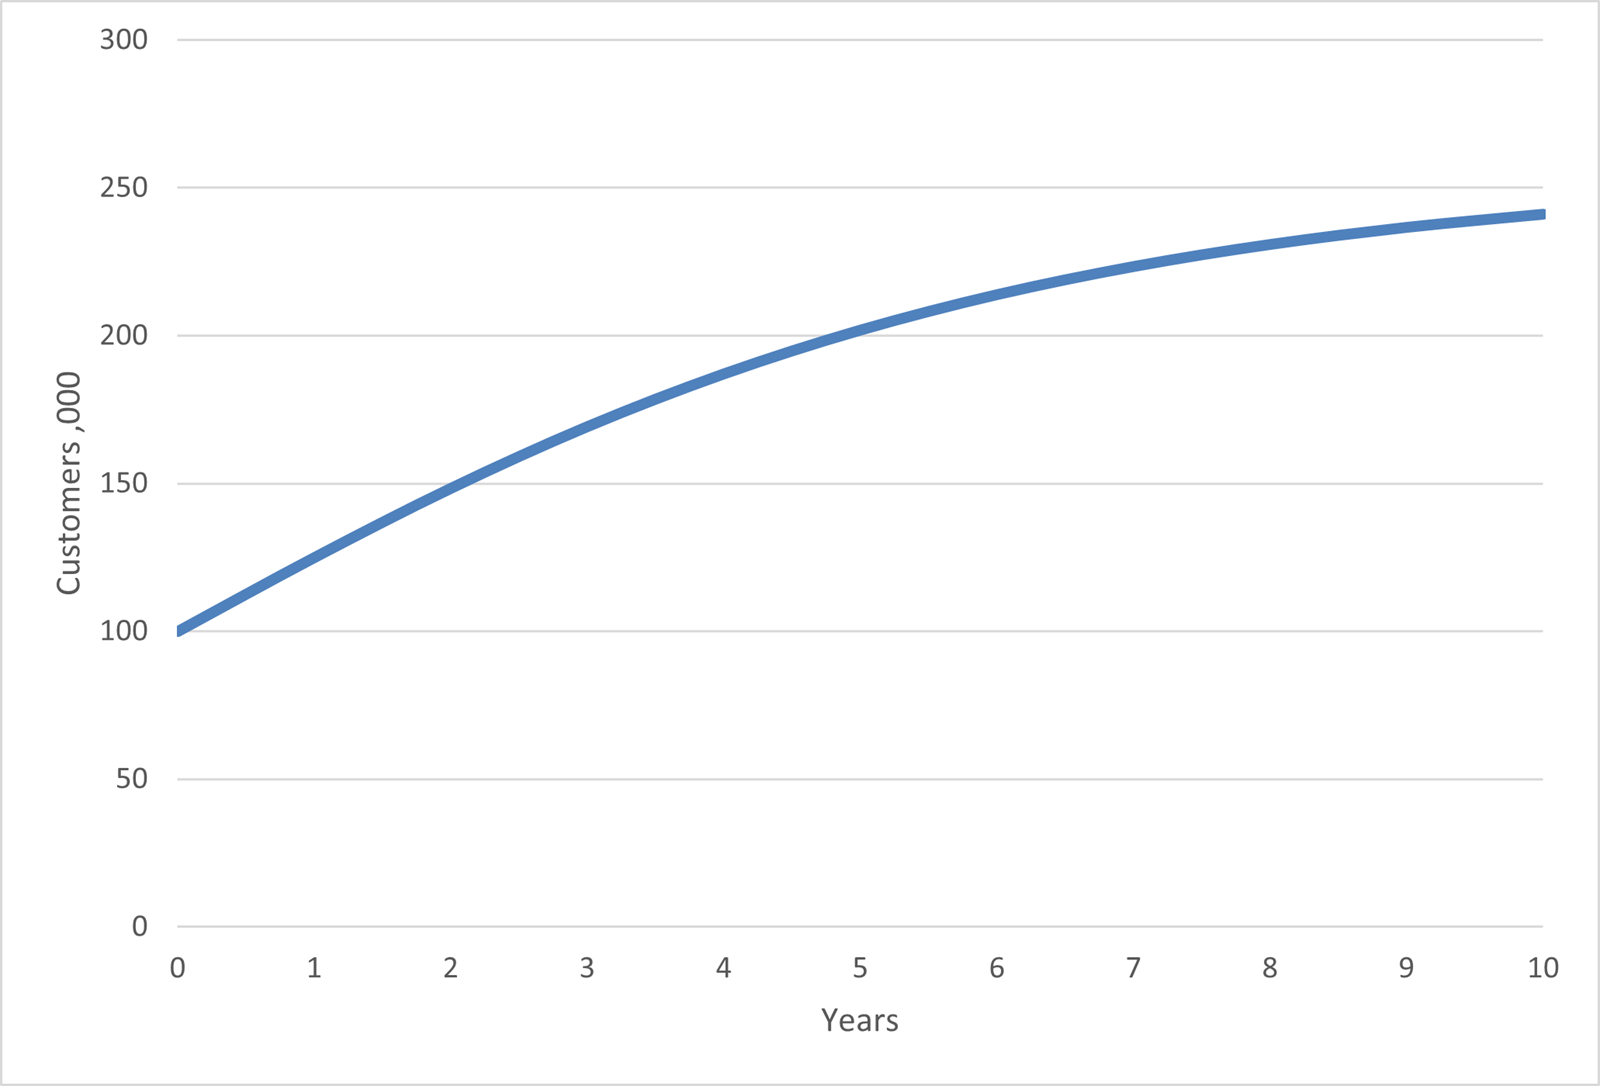
A way to moderate the impact that occurs in the later years is to use a growth rate with annual decay. Here a growth rate is set – we will use 25% and this will decay by 25% each year.
The maths required is:
| Year | 0 | 1 | 2 | 3 | 4 | 5 | 6 | 7 | 8 | 9 | 10 |
|---|---|---|---|---|---|---|---|---|---|---|---|
| Growth | 25% | 19% | 14% | 11% | 8% | 6% | 4% | 3% | 3% | 2% | |
| Customers | 100 | 125 | 148 | 169 | 187 | 202 | 214 | 223 | 231 | 237 | 241 |
Starting with 100 and each subsequent year being multiplied by 1+ a growth rate. The growth rate is reducing by 25% each year. E.g., in year 2 the growth rate is 25% * (1-25%) = 18.75%. In year 3 the growth rate is 18.75% * (1-25%) = 14.0625% and so on.
This time the customer numbers finish sensibly with small increments as the total reaches the saturation of its segment, but in order to create sufficient volume it perhaps starts too aggressively in the first three years.
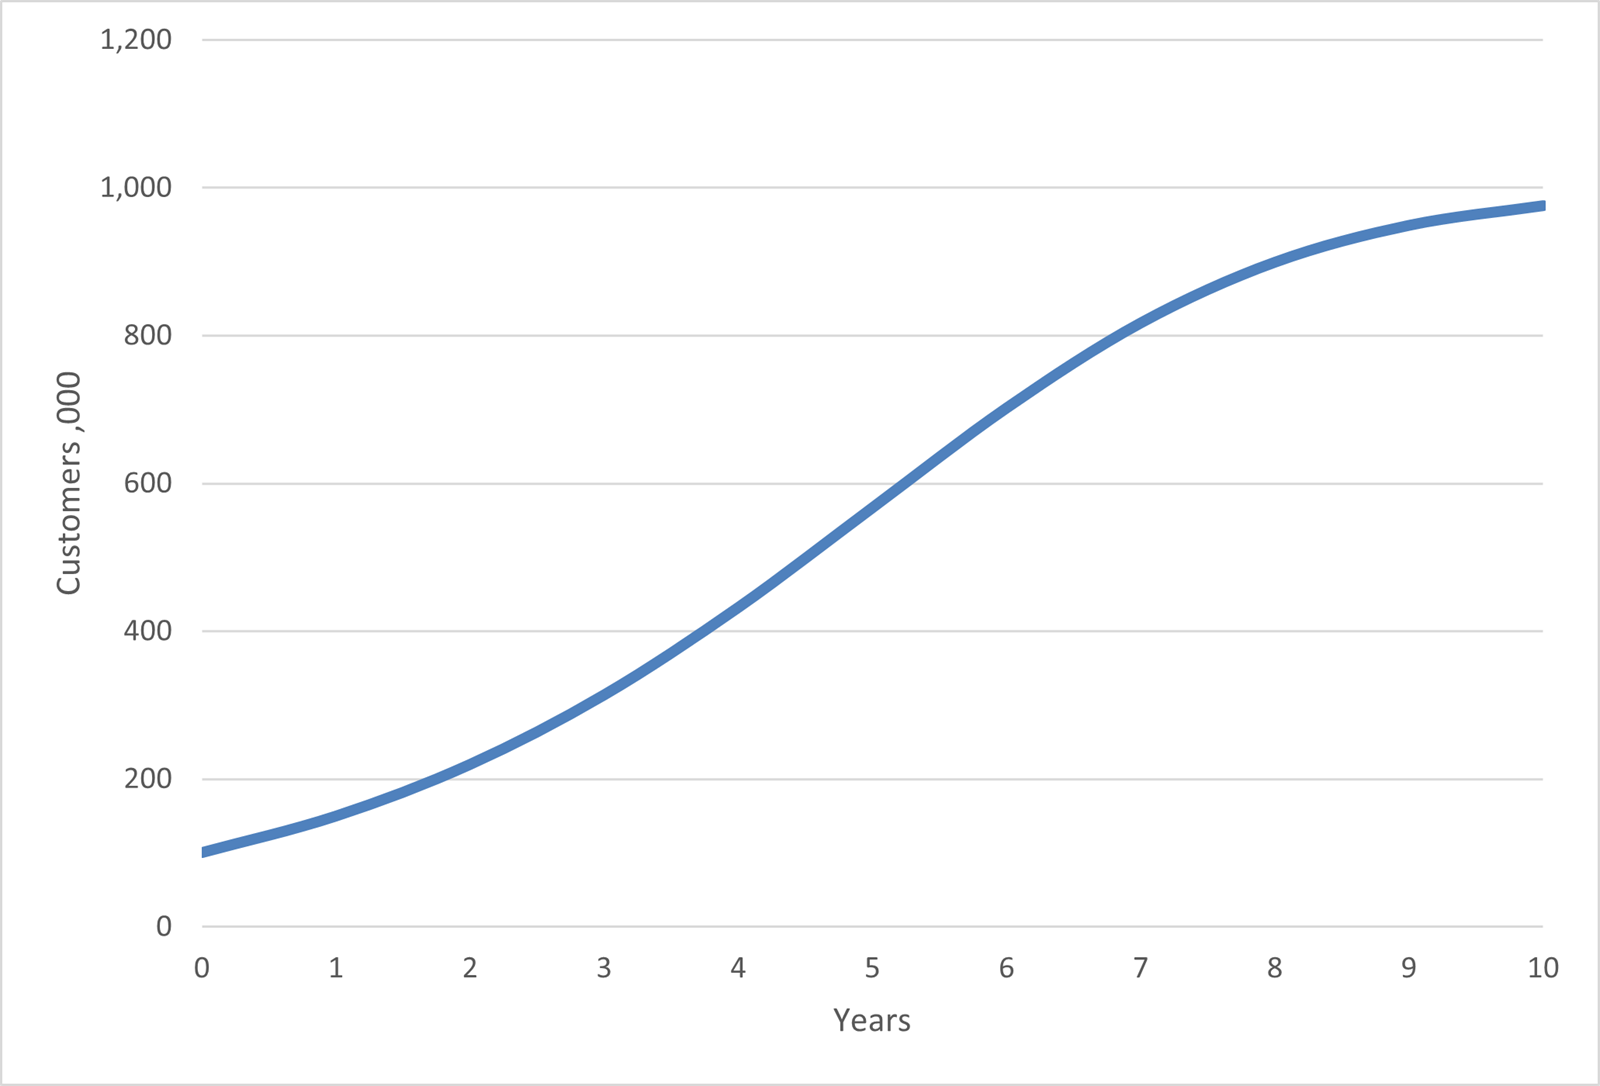
We therefore have the first method with a realistic start but unrealistic finish and a second method with the opposite; a realistic finish and an unrealistic start. The solution is what is call a Bass diffusion curve that is an S shaped chart that provides a realistic start and finish.
The Bass diffusion model was developed by Frank Bass and John Norton in the late 1980s. It was used to model the take up of technology and specifically mobile phones. It is based on the principle of innovators (early adopters driving initial growth) and imitators (late adopters driving mass roll out). There are lots of articles available on the internet if you wanted to read further about this.
The chart looks like this:
Although it looks complex, the maths is in fact relatively straight forward.
What is needed is the maximum value of customers that the business will achieve (in this example 1,000). The growth rate starts at a fixed percentage (we are using 55%), but each year the growth rate is multiplied by the proportion of the market remaining to be captured. Therefore, the faster the business grows the smaller the growth rate next year.
The maths required is:
| Year | 0 | 1 | 2 | 3 | 4 | 5 | 6 | 7 | 8 | 9 | 10 |
|---|---|---|---|---|---|---|---|---|---|---|---|
| Market | 1000 | 1000 | 1000 | 1000 | 1000 | 1000 | 1000 | 1000 | 1000 | 1000 | |
| New Cust | 50 | 70 | 94 | 118 | 135 | 135 | 115 | 82 | 50 | 27 | |
|
Total Cust |
100 | 150 | 219 | 314 | 432 | 567 | 702 | 817 | 899 | 949 | 976 |
The market here is set at 1,000,000 customers and the total customer numbers will not rise above this. The formula is: customers so far * growth factor * proportion of market available.
A growth factor of 55% is used. So, in year 1 the new customers is:
100 * 55% * 900/1000 = 49.5 new customers.
In this example the maximum market is assumed to stay flat at 1,000,000 over the period. In reality this too may grow, and the S shaped curve becomes what is known as a ‘Swan’s neck’.
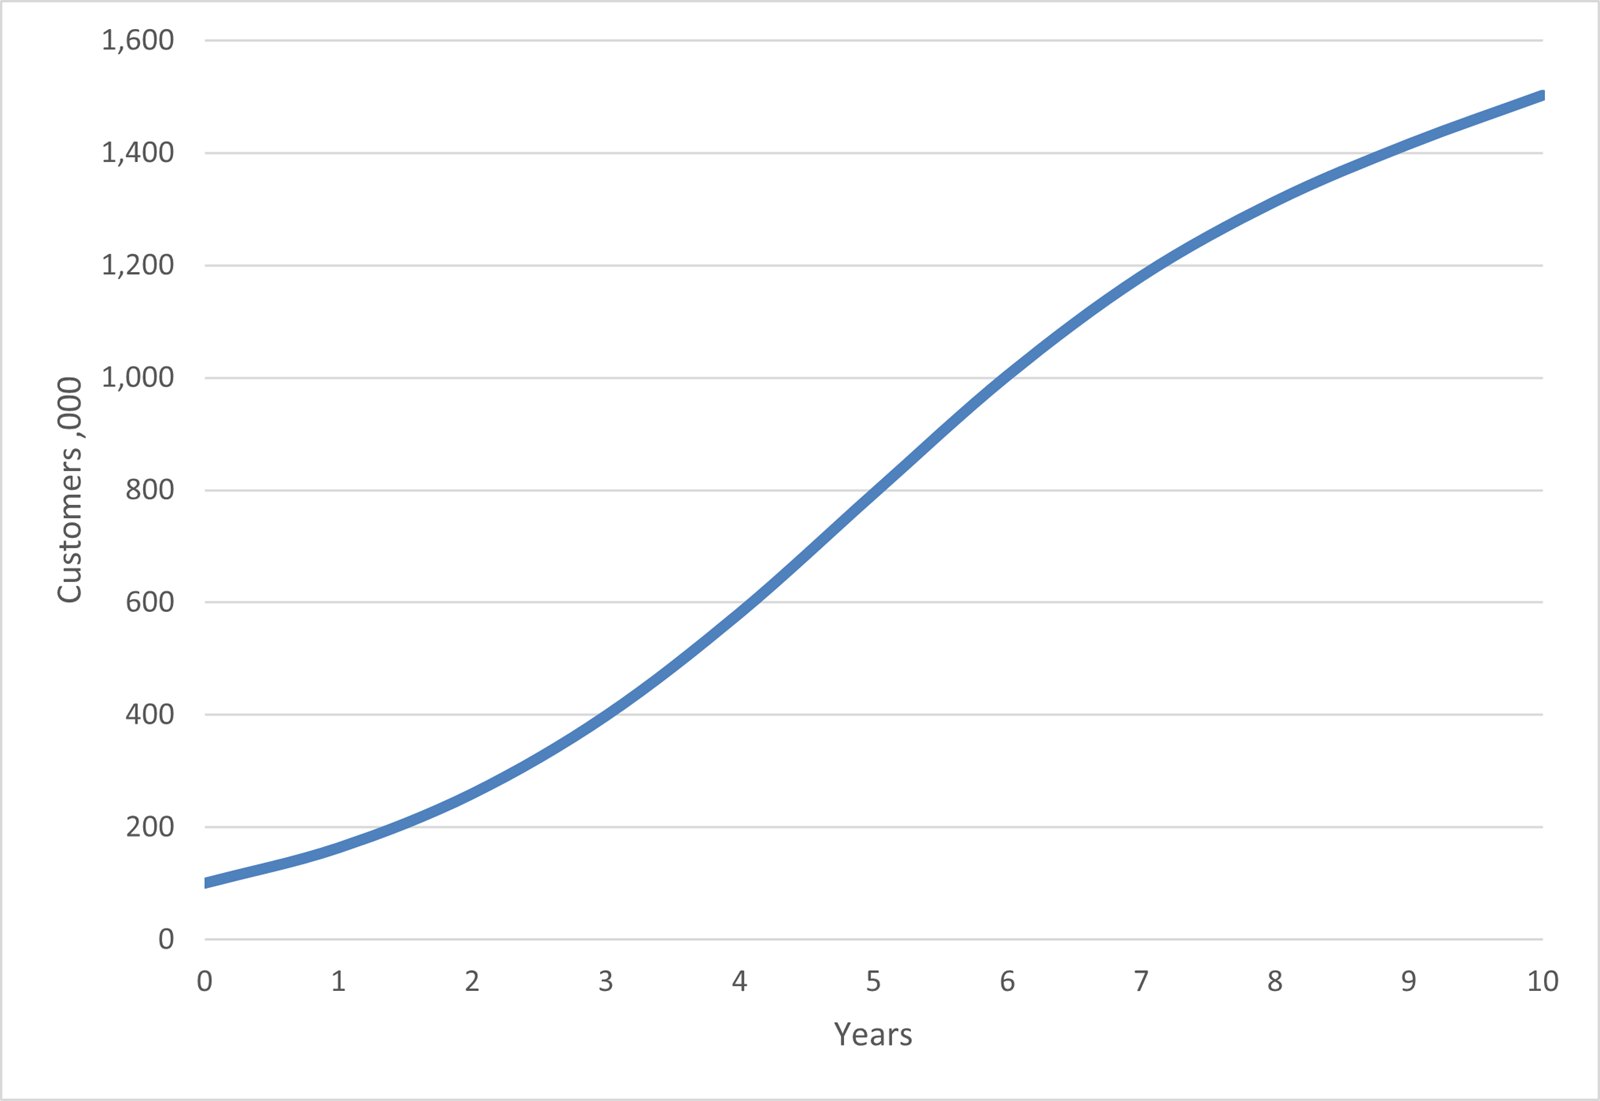
In this example the market of 1,000,000 customers is growing at 5% per year and the growth rate has been set at 70%.
In all the examples some exaggerated growth rates are being used to make the shapes of the charts easier to identify. In reality, you would probably use some lower rates than those shown.
The difficulty with modelling the future is judging the appropriate growth rate and there is no easy answer as to how you derive the values. If you have prior experience of similar projects then they can give you a base to work from, but of course even these will have differences - location, market maturity, the economy….
The best way to develop assumptions is to look at a range of scenarios – ‘what happens if…’ by exploring a range of alternative assumptions you can understand sensitivity and expectations. With Excel you can also reverse engineer assumptions. Instead of calculating what will happen if growth is x%, the opposite is ‘what is the minimum growth level we need to have a viable project?’. Knowing the minimum value then allows you to monitor each year as to whether it is running above or below that critical value.
The final part of this series will cover Normal distribution curves and probabilities of success. These are ways to interpret the results of business case scenarios and calculate the likelihood of risk.
Archive and Knowledge Base
This archive of Excel Community content from the ION platform will allow you to read the content of the articles but the functionality on the pages is limited. The ION search box, tags and navigation buttons on the archived pages will not work. Pages will load more slowly than a live website. You may be able to follow links to other articles but if this does not work, please return to the archive search. You can also search our Knowledge Base for access to all articles, new and archived, organised by topic.