
Part 3 of this series explored regression analysis and methods to identify ‘lines of best fit’ through data and then use this to extrapolate future values. The fourth part of this series will deep dive into a range of calendar functions that help with budgeting and interpreting monthly performance data.
Take for example the question – ‘what are our sales per day’? The total sales value by month may be easily captured, but simply dividing this number by the number of days in the month is somewhat naive especially when the business may be closed on a Sunday and the month may contain a bank holiday or two. Better insight will be derived from knowing the number of trading days.
Dates in Excel
Dates in Excel are stored as a number with 1 being 1 Jan 1900 and counting upwards. 30 Sep 2023 has reached day 45,199. NB Any fractional element relates to the time during that day.
To create a date in Excel format, use the function =DATE(year, month, day).
To display a date, use the function =TEXT(number, “dd mmm yy”) the format string in quotes has a range of options:
d = day numerically
dd = a two-digit day with a zero preceding days less than 10
ddd = a three-letter day of the week – Mon, Tue, Wed…
dddd = the full word for the day of the week – Monday, Tuesday, Wednesday…
m = month numerically
mm a two-digit month with a zero preceding months less than 10
mmm = a three-letter month name – Jan, Feb, Mar…
mmmm = the word for the month – January, February, March…
yy = the last two numbers of the year
yyyy = the full four-digit year
End of Month
In preparing column headings for the last day in each month of the year could easily be typed but can also be generated much more quickly with the function =EOMONTH(start date, months). For the ‘months’ field 0 is the current month and counting upwards or downwards from there. Combined with the =SEQUENCE(rows, columns, start, step) function a series of 12 column headers can be quickly created. If step is omitted the default is 1.
The combination being =EOMONTH("1/1/23",SEQUENCE(1,12,0)) will give 12 column headings across the worksheet.
Working days
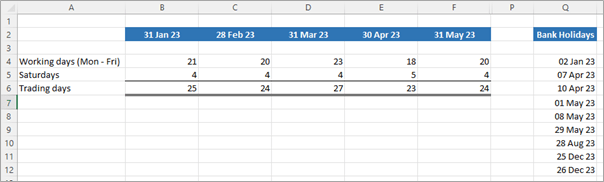
The function =NETWORKDAYS(Start date, End date, Bank holiday array) gives the number of working days (Mon to Fri) in a date range. The bank holiday array being a block of dates covering each bank holiday. In the example below see the array Q4:Q12 where all the 2023 bank holidays are listed.
Number of days in a month of a particular day of the week.
The function =Weekday(date, return type) will tell you the day of the week for a particular date. ‘return type’ sets the type of response required. If this is set as 1 then Sun gives 1 through to Sat being 7, if set as 2 then Mon gives 1 through Sun being 7. There are eight further permutations. All the options can be seen if the function is typed into an Excel cell, a date is entered and the comma inserted.
To calculate the number of Saturdays in a month use the formula:
=INT((WEEKDAY(start date -7,1) + end date – start date)/7)
With ‘return type’ set as 1 the number in red is the day of the week you want to count – in this example Saturday which is 7.
The =INT(number) takes the integer value of the number (cutting off any fractional element). It is the same as =ROUNDDOWN(number,0).
We can now pull all these functions together and calculate the number of trading days in the month excluding Sundays and bank holidays.
Dividing sales by the number of trading days now results in much more insightful analysis of performance. In 2023 April had 4 less trading days than March (almost 15%). While this is partly the impact of Easter, the overall effect will substantially impact results and the ability to interpret the volatility of monthly sales levels.
Seasonalising data
In preparing budgets it is helpful to focus equally upon how it will be generated monthly through the year as it is upon setting a total for the whole year. The reason being that as the months unfold gauging whether the business is ‘on track’ becomes much easier. A very seasonalised business with high summer sales is likely to be showing low results in the winter, this is not alarming just the nature of the customer demand.
The easiest way of understanding seasonality is to look back over past years (ideally at least three). Take for example the following data. There are clearly some high months and low months, and each year has a similar pattern.
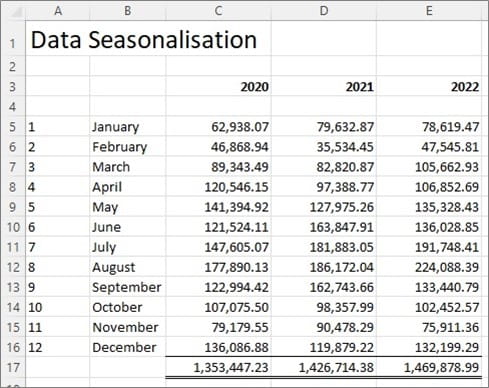
To understand this more accurately it can be helpful to make the total for each past year 100% and then look at the proportion of the total that each month contributes.
If each month of the year was equal, then there would be 100%/12 = 8.333% per month.
Applying this to our example gives the following results. With the function =AVERAGE(range) used to smooth the three years of data.
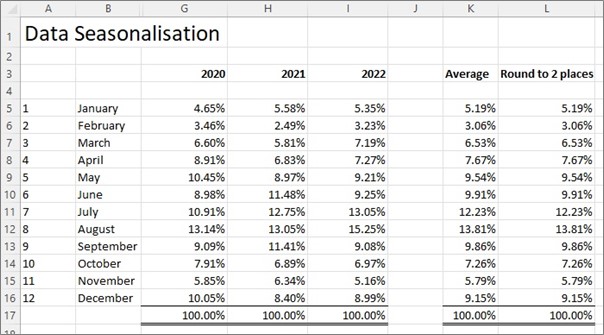
This gives a useful basis to prepare the budget knowing the achieved results.
Be careful of the impact that the Pandemic has had on data from 2020 to 2022 and whether this is a valid profile for more normal trading going forward. For some businesses it is helpful to look back to pre-2020 data to see these type of pattens.
It may also be helpful to look at the number of working days for each of these historic months which may explain some the higher and lower values that arise for any particular month. Two extra trading days in a month can add up to 10% more to a business.
Adding trading days and a seasonality factor to assumptions on inflation and demand changes can help a budget reflect a much more realistically expectation of future results.
In the next part of the series, we will explore Bass diffusion curves as an effective way to forecast revenue and market shares. This gives a far more realistic result than simple growth rates that can compound up unrealistically after a few years.
Archive and Knowledge Base
This archive of Excel Community content from the ION platform will allow you to read the content of the articles but the functionality on the pages is limited. The ION search box, tags and navigation buttons on the archived pages will not work. Pages will load more slowly than a live website. You may be able to follow links to other articles but if this does not work, please return to the archive search. You can also search our Knowledge Base for access to all articles, new and archived, organised by topic.