
Reminding readers here of principle 1 described in part 1 of this series – ‘The past does not predict the future’. The benefit of this analysis is to provide an indication of what might happen should trends continue.
Existing Data
Take for example the following data of product sales by month:
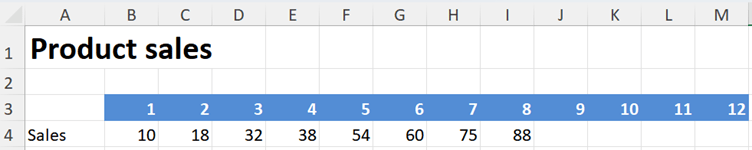
Based on the experience of the first eight months what might be the expectation for the rest of the year?
Least squares regression identifies the line of best fit through the data by minimising the sum of the squares of the distance between each data point and a trendline.
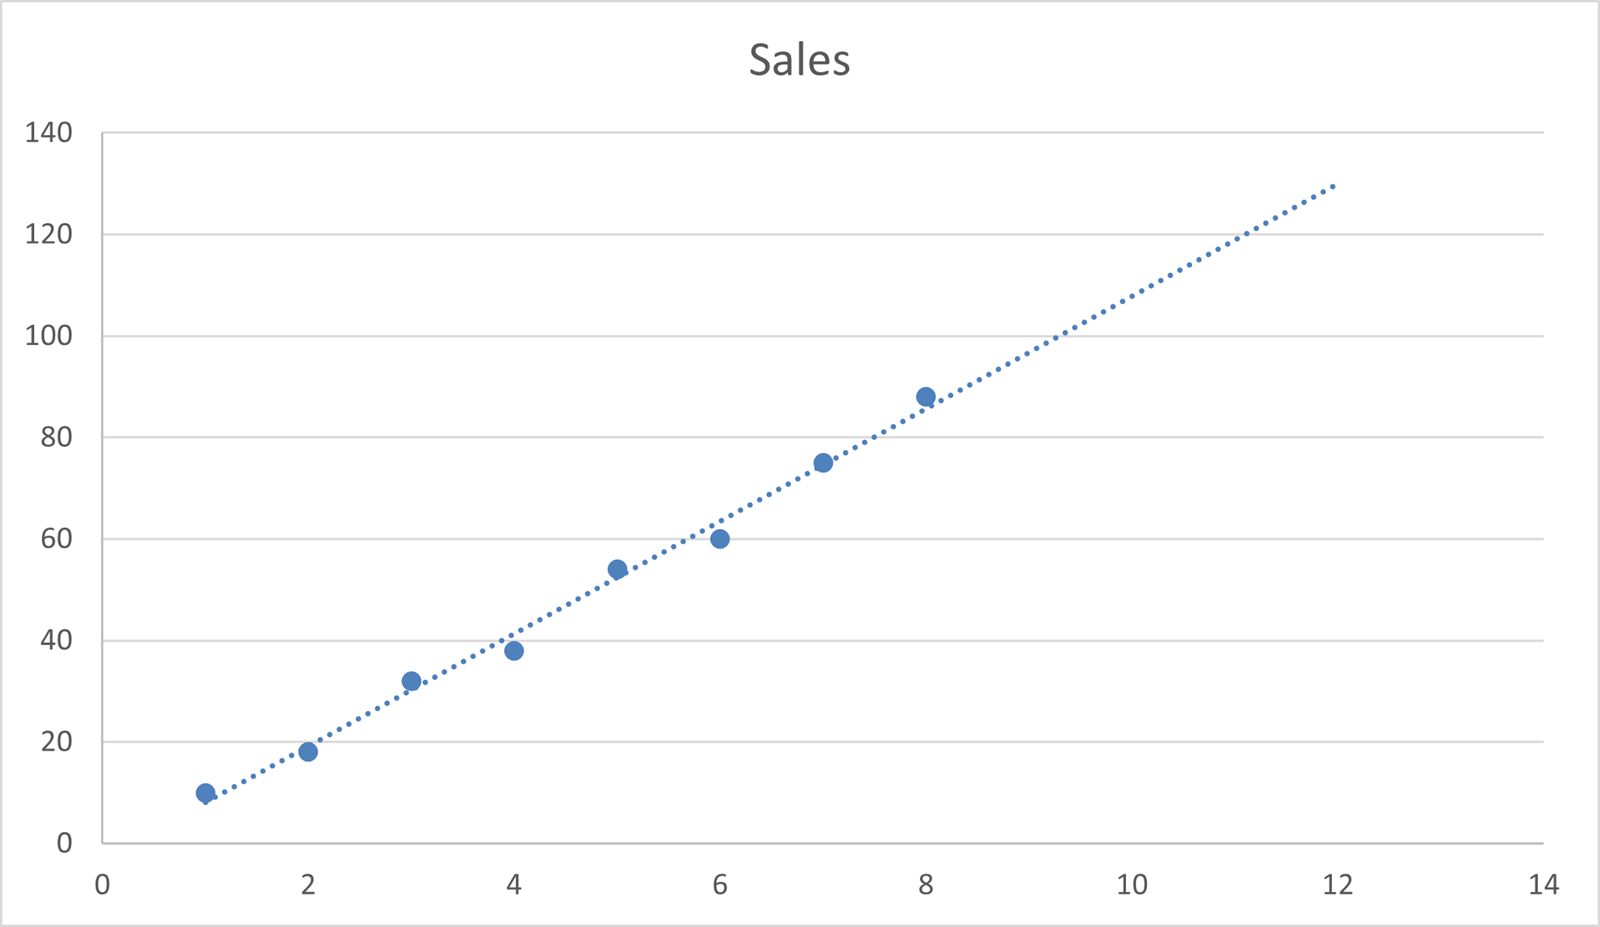
On the chart below is plotted the data above with a trendline of best fit. All this can be done in Excel using both charts and a set of functions.
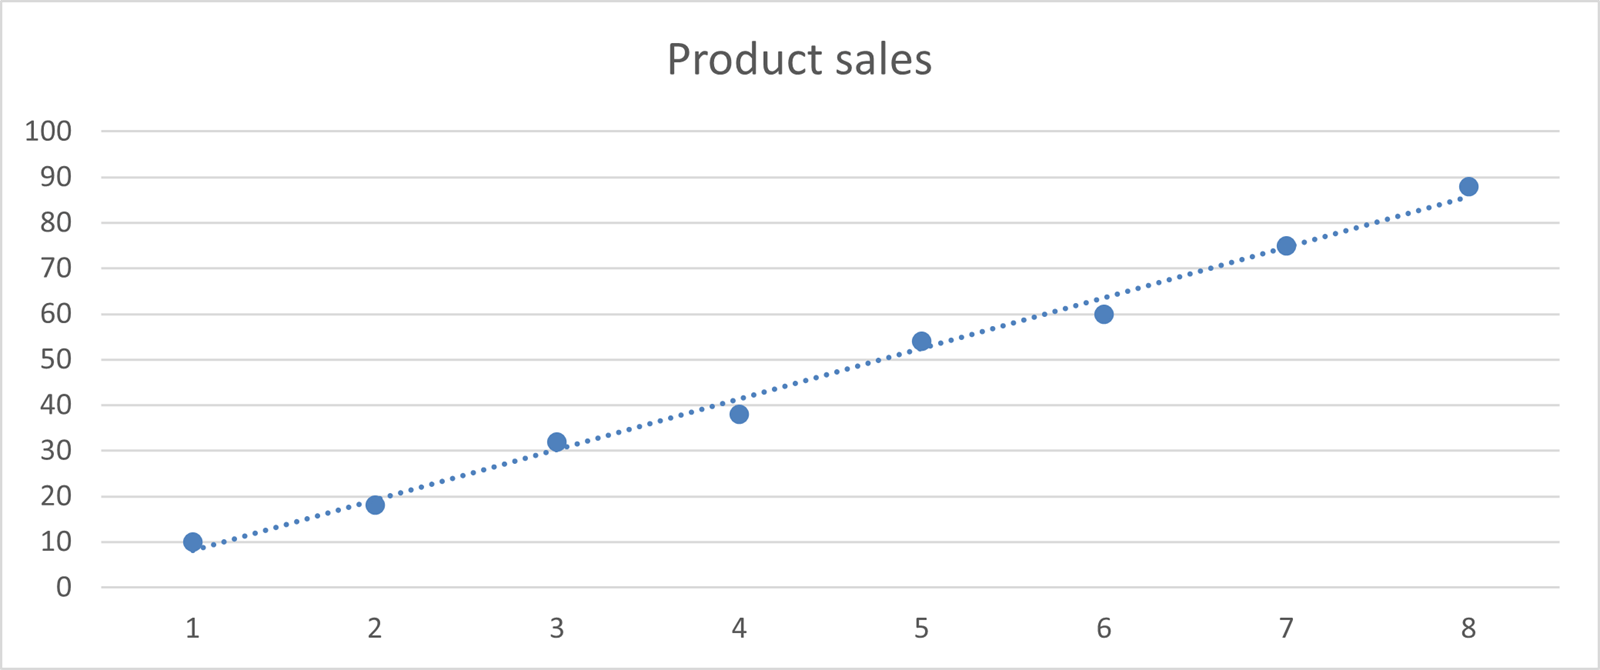
One ‘beware’ before we get into the details is where there are outlier data points. Because the technique uses the lowest sum of the squares of the distance each data point is from the trendline, an
We will complete the analysis with charts initially then with functions.
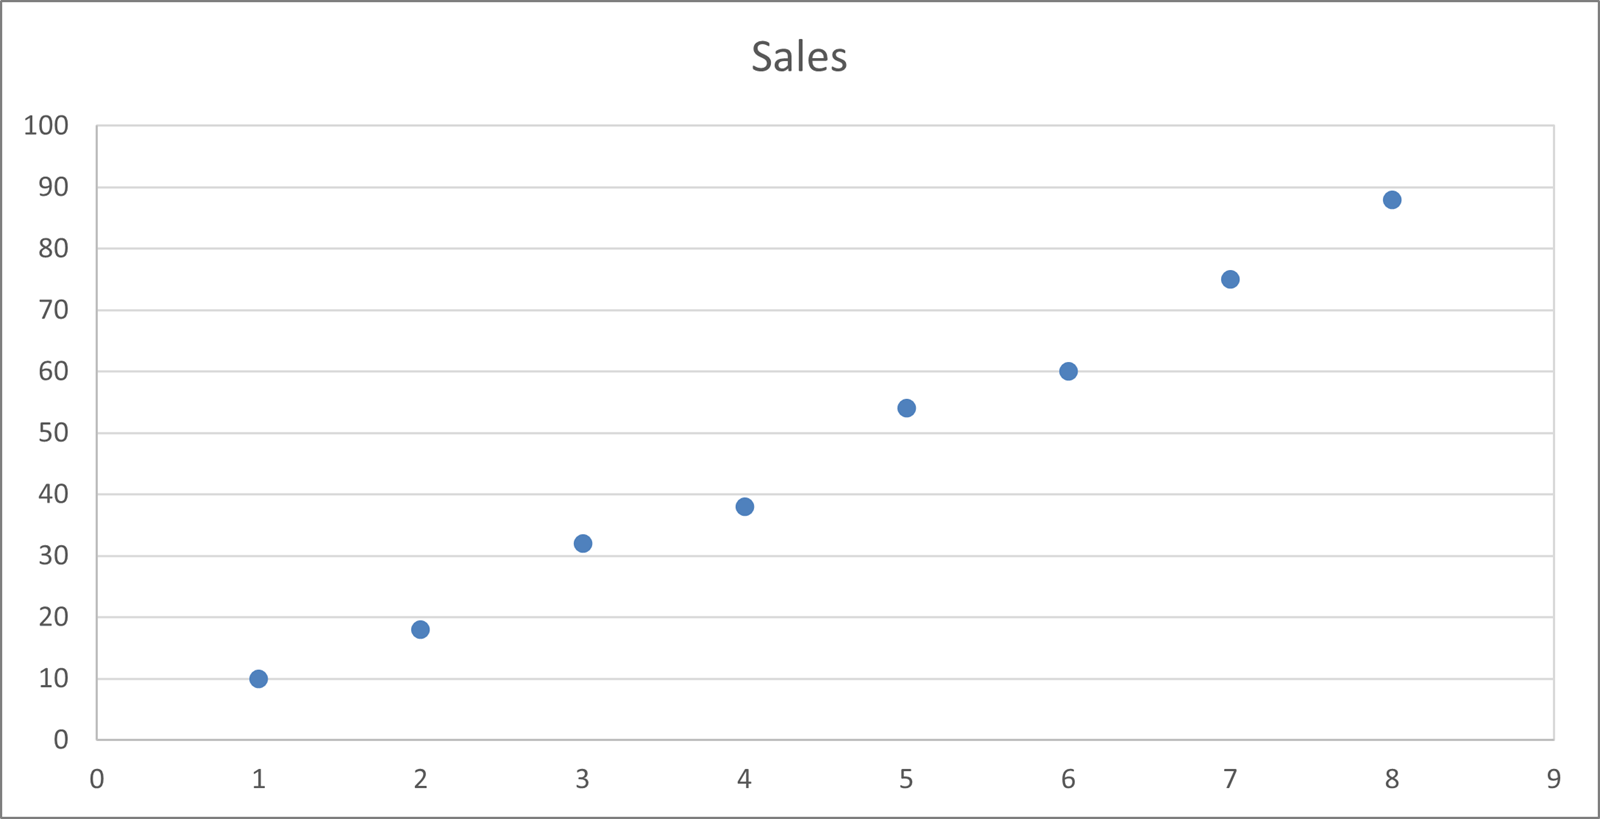
First of all plot all the data as a chart – this can be a Line chart or in this example we are using a Scatter chart (which makes the trendline clearer to see).
To get the trendline right click any of the data points and a context sensitive menu appears as follows:
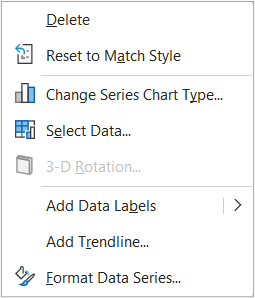
Select Add Trendline… and several options appear in the righthand menu for Format Trendline:
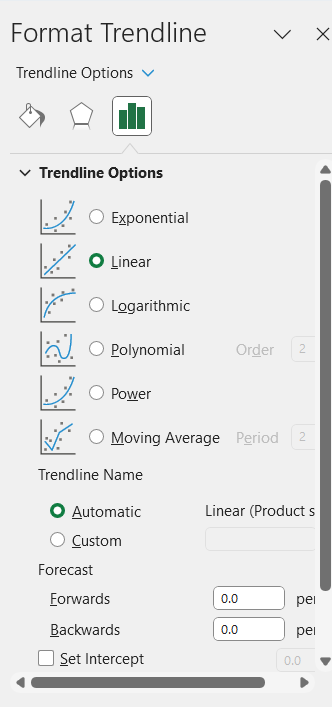
First select the type of trendline you are applying to the data – in this case we are only exploring Linear, but once this menu is discovered there are five other options to explore.
Further down you will see a Forecast section where you can extend the trendline Forwards or Backwards to predict new values. We are going to go Forwards 4 periods to the end of the year. The chart will now look as follows:
Whilst this may be useful, we do not want to be reading the future values off charts.
The next stage is to identify the equation for the line of best fit. If you scroll down the right-hand dialog box after the Forward and Backwards section, there is a tick box for ‘Display Equation on chart’. Beside the line will be shown:
Y = 11.083X – 3 (remember Y is the vertical axis and X is the horizontal axis).
This now allows future values to be accurately calculated. However, there are easier methods all with Excel functions as follows:
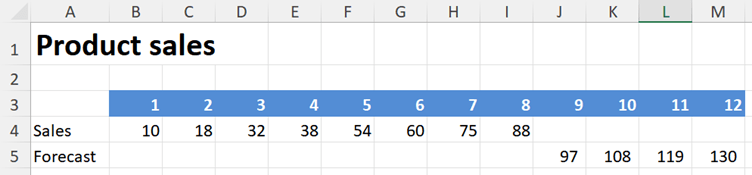
There are two functions to forecast values based on existing data they are =FORECAST and =TREND both have the same outputs but reversed construction – the examples are shown for cell J5
=FORECAST(X, Known Ys, Known Xs) =FORECAST(J3,B4:I4,B3:I3) = 96.75
=TREND(Known Ys, Known Xs, X) =TREND(B4:I4,B3:I3,J3) = 96.75
There are also two functions that will generate the equations for the trendline =SLOPE and =INTERCEPT
=SLOPE(Known Ys, Known Xs) = SLOPE(B4:I4,B3:I3) = 11.0833
=INTERCEPT(Known Ys, Known Xs) =INTERCEPT(B4:I4,B3:I3) = -3
Using the Equation values for month 9 = (9 * 11.0833) – 3 = 96.75
Using these functions it is possible to automate all the Least Squared regression calculations and generate lines of best fit to extrapolate indicative future values.
In the next part of this series, we will explore Day counts and techniques for calendarising seasonal data – these are really helpful tools for budget planning – using mathematics to enhance judgement.
Archive and Knowledge Base
This archive of Excel Community content from the ION platform will allow you to read the content of the articles but the functionality on the pages is limited. The ION search box, tags and navigation buttons on the archived pages will not work. Pages will load more slowly than a live website. You may be able to follow links to other articles but if this does not work, please return to the archive search. You can also search our Knowledge Base for access to all articles, new and archived, organised by topic.