This week’s chart takes a dive into the latest financial statements of the United States Government for the year ended 30 September 2022 that were published on 16 February 2023, illustrating how the consolidated balance sheet of the executive, legislative and judicial branches has changed over the last five years.
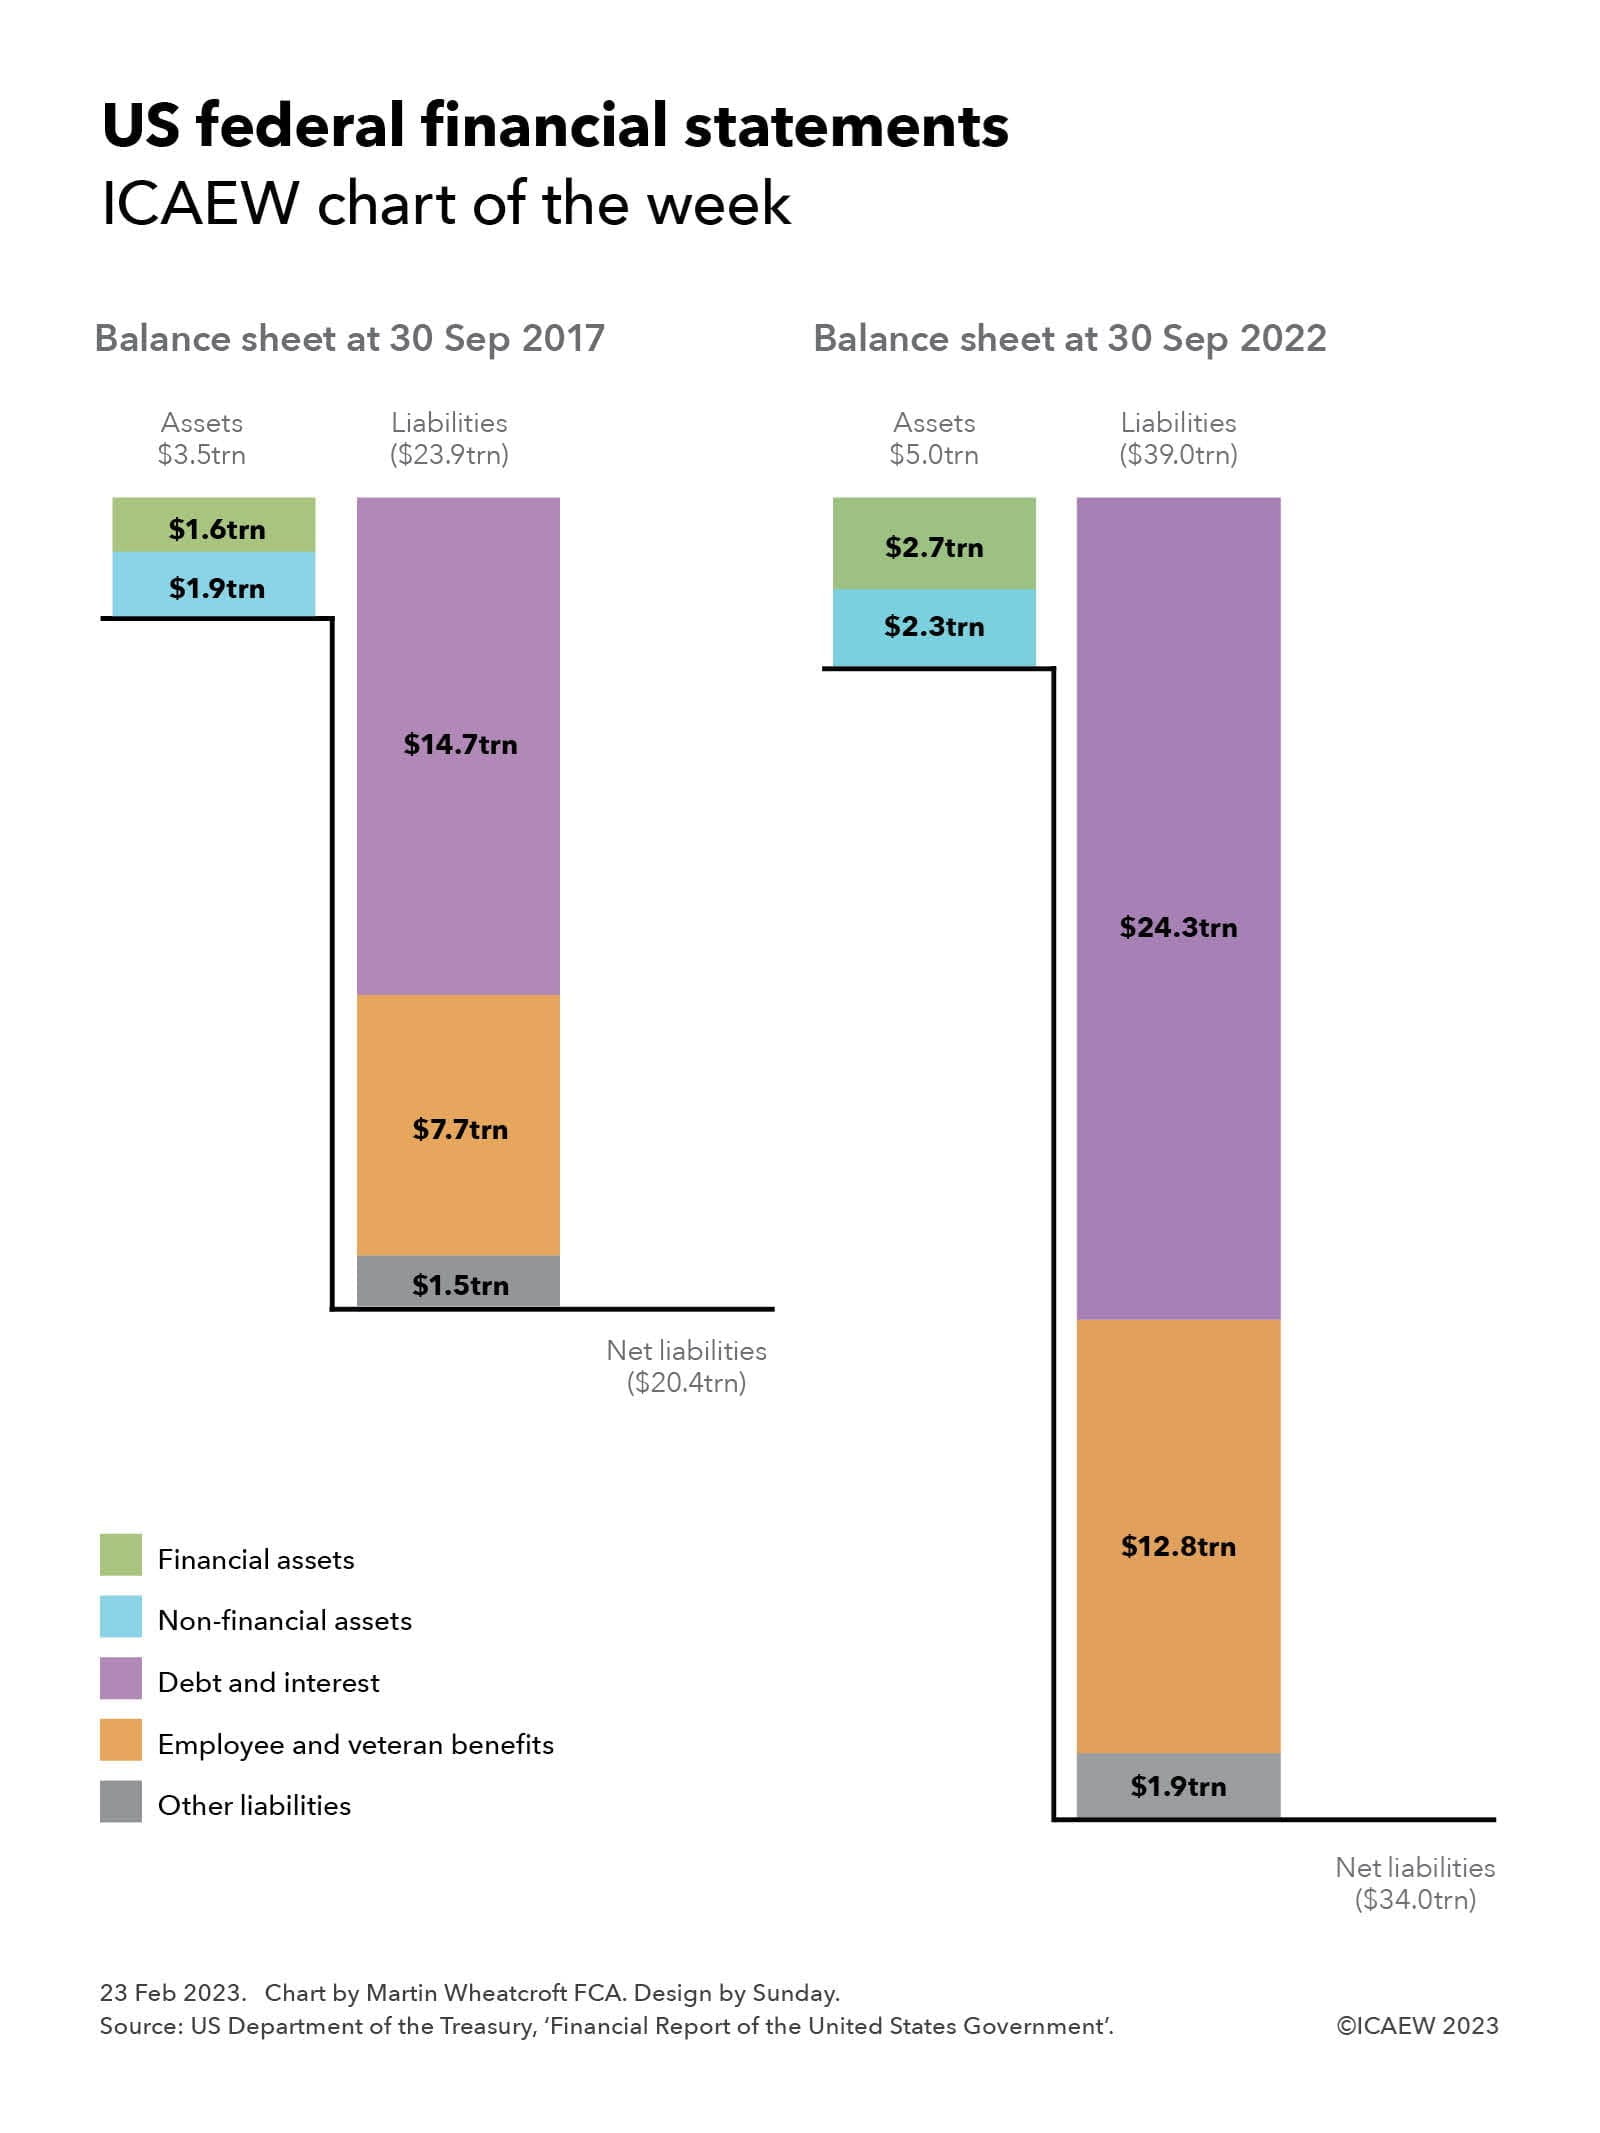
The federal government reported net liabilities of $20.4trn at 30 September 2017, comprising $3.5trn in assets ($1.9trn non-financial and $1.6trn financial) less $23.9trn in liabilities ($14.7trn debt and interest, $7.7trn employee and veteran benefits and $1.5trn other liabilities).
By 30 September 2022, net liabilities had increased by 67%, from $13.6trn to $34.0trn, comprising $5.0trn in assets ($2.3trn non-financial and $2.7trn financial) less $39.0trn in liabilities ($24.3trn debt and interest, $12.8trn employee and veteran benefits and $1.9trn other liabilities).
The increase in net liabilities is a consequence of net accounting losses of $1.2trn, $1.4trn, $3.8trn, $3.1trn and $4.2trn for the five financial years up to 30 September 2022. These amounts are calculated in accordance with US generally accepted accounting principles (US GAAP) as adapted for government by Federal Financial Accounting Standards (FFAS) issued by the Federal Accounting Standards Advisory Board (FASAB). They differ from cash budget deficits (outlays less receipts) of $0.8trn, $1.0trn, $3.1trn, $2.8trn and $1.4trn over the same period.
Revenue in the year ended 30 September 2022 of $4.9trn comprised $4.0trn from individual income taxes and tax withholdings, $0.4trn in corporate income taxes and $0.5trn in other taxes and receipts. The net cost of government operations amounted to $9.1trn, comprising $7.4trn in gross costs less $0.5trn in fees and charges plus $2.2trn from changes in assumptions. The latter primarily relate to employee and veteran benefit obligations that are on the balance sheet in the US GAAP numbers.
The scale of the negative balance sheet and continued deficit financing highlight just how dependent the US federal government is on its ability to borrow money as needed to meet its financial obligations as they fall due, and why the current challenge in raising its self-imposed debt ceiling is starting to concern markets.
This is the 250th ICAEW chart of the week, a milestone that has crept up on us as we seek to share insights into the economy and public finances that we hope are of interest to ICAEW members and all our other readers. Many thanks for your continued interest and we look forward to providing you with many more nuggets in the future.
Latest charts
Recommended content
ICAEW Community

Public Sector Community
The go-to place for guidance on issues affecting finance professionals working in and with the public sector. With a range of dynamic services, ICAEW provides valuable tools, resources and support tailored to the public sector.
Resource

More economic insight
ICAEW works with Oxford Economics to provide useful insight and timely intelligence for finance professionals and their clients.
Read moreResource

Energy crisis hub
Analysis of how supply difficulties, rising electricity prices and sanctions against Russia are contributing to turmoil in energy markets. Find out what business can do to lessen the impact.
Find out more