
Hello all and welcome back to the Excel Tip of the Week! This week we have a Developer level post in which we’re going to look at how to make some more unusual types of measures in Power Pivot. If you want a refresher on how Power Pivot measures work, check out TOTW #369 for the lowdown.
The issue – context, context, context
In that post, we looked at how measures work – they allow you to specify calculations based on the names of fields, which are then evaluated in a PivotTable according to the context that applies. So for example let’s take this table of product sales over time:
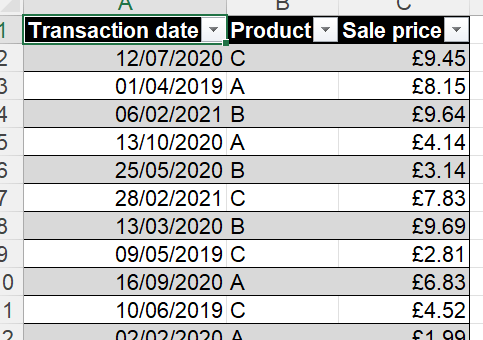
We can load this in to PP and create a related data table to handle the dates. We then create a simple total measure with SUMX:
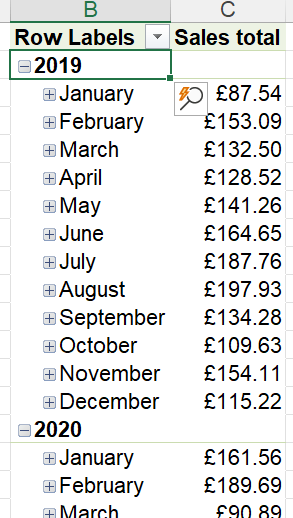
Sales total:=SUMX(SalesData,[Sale price])
Output into an example pivot, we get this:
Now, what we want to do is create a running total measure that will show the total sales building up over time. First of all, it’s worth noting that if you just want year to date sales, there’s a simple function for that:
YTD sales:=CALCULATE([Sales total],DATESYTD('Calendar'[Date]))
However, this will reset at the end of each year. We want a cumulative running total that will continue to build up over each year.
We might consider a line of reasoning like this: We want to total the sales which occurred on or before the current date. The current date can be computed using MAX([Transaction date]), so we might try a measure like this:
Naive running total:=CALCULATE([Sales total],FILTER(SalesData,[Transaction date]<=MAX([Transaction date])))
The name of this measure might have given the game away, however – this is what it looks like when added to our pivot:
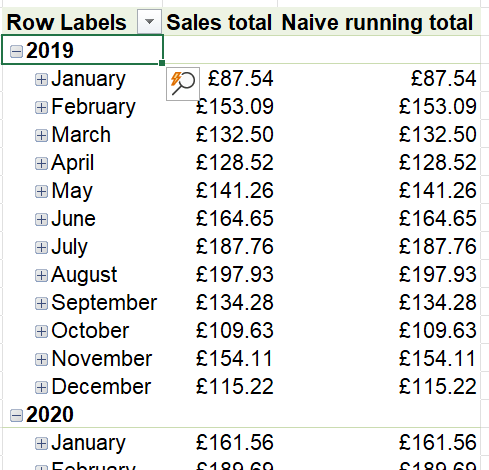
As you can see, the measure just duplicates the sales totals. What’s gone wrong here?
The problem is as follows. Our MAX can compute the latest date for each location in the pivot, because the dates are adjusted by context. But the list of transactions available are also being adjusted based on context! So in each location only the that month’s transactions are available at all.
Two approaches for fixing this
There are two ways that we can look at to resolve this issue. The simplest is simple to remove all other filter context from the data by using the ALL function. Then we can apply just our “past dates” filter and nothing else. That yields this measure:
ALL method running total:=CALCULATE([Sales total], FILTER(ALL(SalesData), [Transaction date]<=MAX([Transaction date])))
This is very close to our previous measure, but with an ALL() wrapped around the item we are filtering.
More interesting for further applications is to get rid of FILTER, and to define our point of comparison – the maximum date – in such a way that it is not affected by filter context and is not recalculated later on. We can do that by using a couple of new elements of DAX syntax – VAR and RETURN.
VAR lets us define a variable, a calculation that will make a one-off computation of a value that is then available to our actual measure later on in the measure. RETURN marks when we’re ready to actually write our measure. It’s easier to see what this looks like in practice:
The line break here is purely cosmetic, but it does make reading the formula much easier. Essentially, we define what MaxDate means up-front and then use it later on in the measure.
Both approaches yield our desired results:

But the idea of VAR and RETURN also lets us cut down on calculations by using variables for sub-stages in other measures, rather than full additional measures. This can improve performance. For example, here’s a measure for computing prior year sales variance in one go:

Check out all the examples from today’s post in the accompanying file!
- Excel Tips and Tricks #506: Creating a single master list after merging data
- Excel Tips and Tricks #505 – 3 ways of converting US Dates into UK formats
- Excel Tips and Tricks #504 - Accessing accessibility checkers for good spreadsheet practice
- Excel Tips and Tricks #503 – Printing under pressure, super quick presentation tips
- Excel Tips and Tricks #502
Archive and Knowledge Base
This archive of Excel Community content from the ION platform will allow you to read the content of the articles but the functionality on the pages is limited. The ION search box, tags and navigation buttons on the archived pages will not work. Pages will load more slowly than a live website. You may be able to follow links to other articles but if this does not work, please return to the archive search. You can also search our Knowledge Base for access to all articles, new and archived, organised by topic.
