
Introduction
Having created a list of articles that match a set of keywords, we want to add a visual to our existing Power BI portal that allows a user to filter the list of articles with a single click. To do this, we are going to leave our existing articles table as it is except for adding an Index column. We are then going to base our match table on the existing articles table, including the new index.
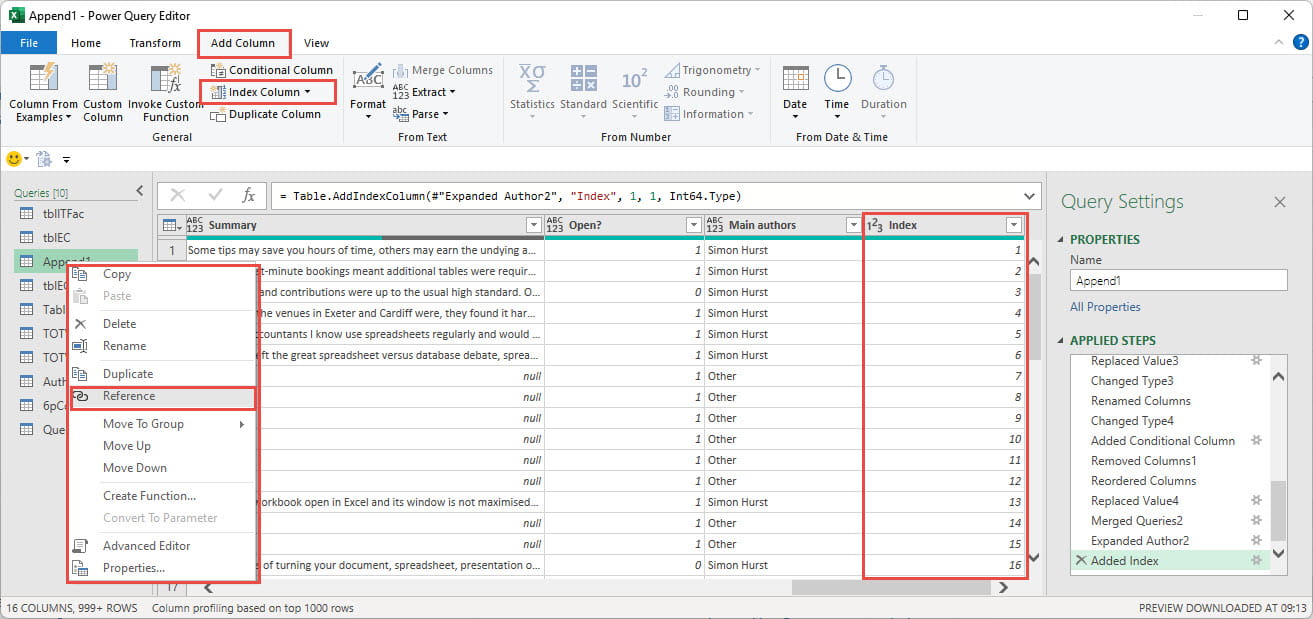
Adding an Index column to a table is straightforward. We just need to go to the Add Column Ribbon tab, General group and click on the Index Column dropdown and choose whether we want our sequential column to start from 0, 1 or a custom value. If we just click the button itself rather than the dropdown, it will default to starting with 0. For no particularly good reason, we will use the dropdown to choose to start from 1.
We now want to create our new match table, using our existing articles table with its new index column as the starting point. To do this, we can just right-click on the articles table query in the Queries pane at the left of the Power Query editor window and choose Reference:
This creates a new table with its source set to the existing query so that, whenever the existing query changes, the change will ripple through to the new table.
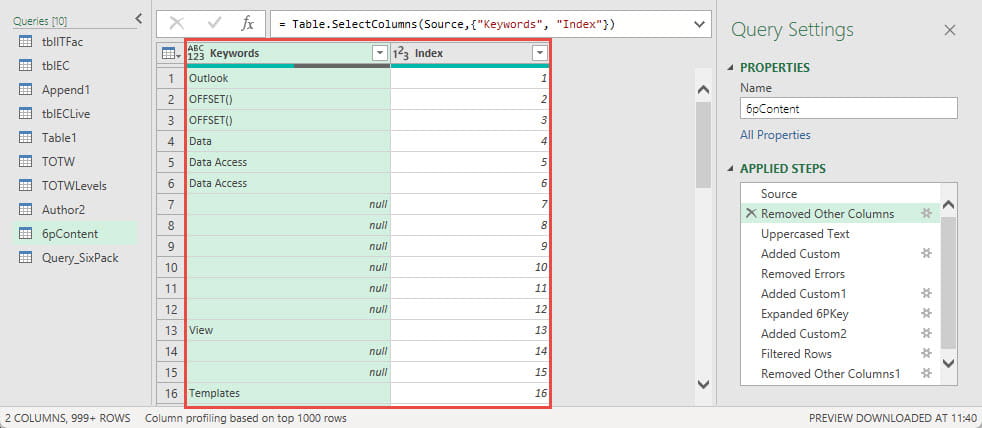
We just need to end up with the Index column from this Table, so we can remove all the other columns, apart from the keywords column that we need to make our match:
We now use the methods set out in our first article to convert the Keywords column to an UPPERCASE List and to add our projects table, already containing its own UPPERCASE keyword list column, to each row:
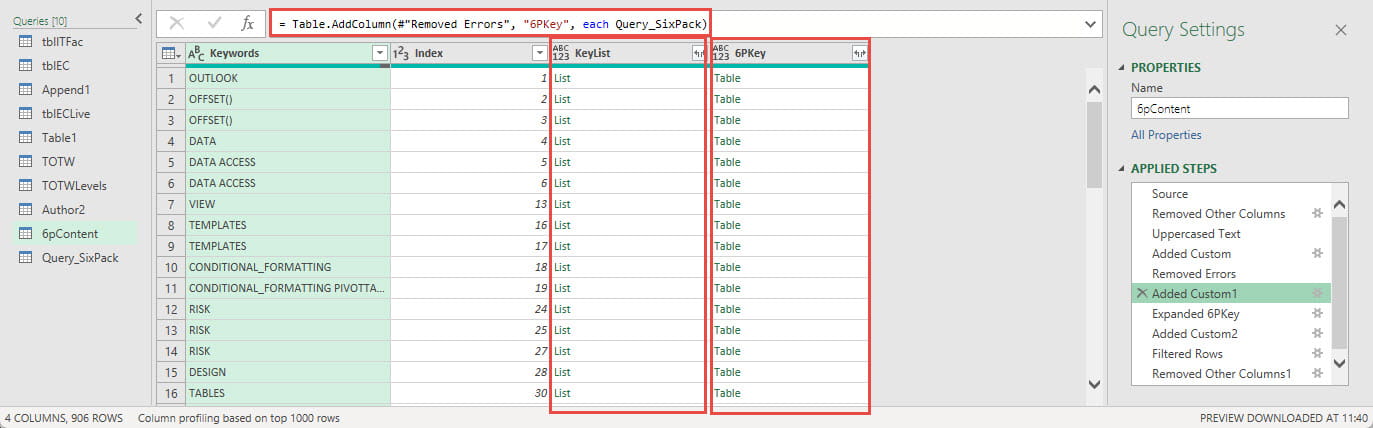
We then expand the Table column to include our project key column and our project list columns. As we saw last time, this adds rows for each project that has existing keywords. We now have our two List columns in our Table and can add a column that uses the List.ContainsAny() function to return TRUE for all rows where there is a match. We filter this column to just include the TRUE rows, then remove all of the columns except the Index and project key columns:
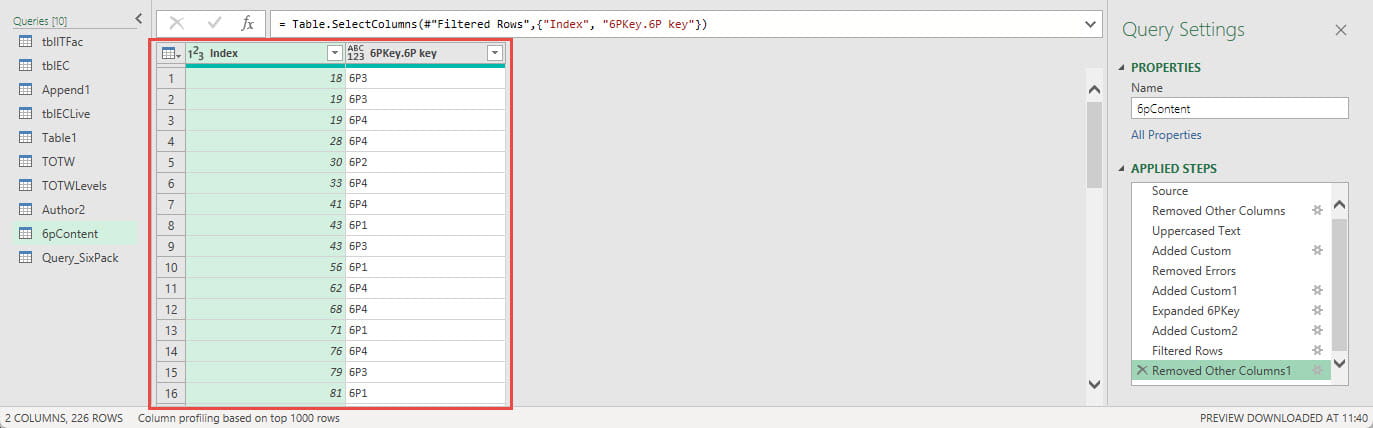
To see all the articles relevant to a particular project item, we could just filter our key column to an individual item and then use the Index column to match the Index column in the articles table. However, we don’t want to do this in Power Query, instead we want to do it in our Power BI report.
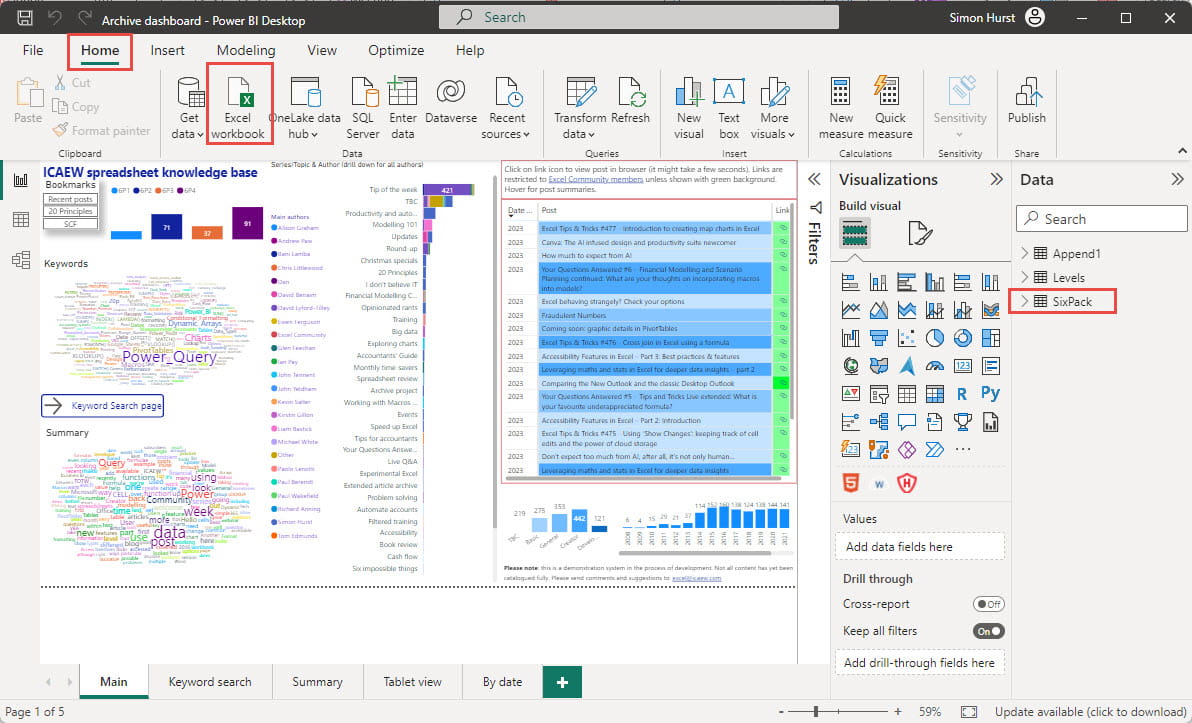
In Power BI we can use the Home Ribbon tab, Data group, Excel workbook command to add our new table to our source data tables:
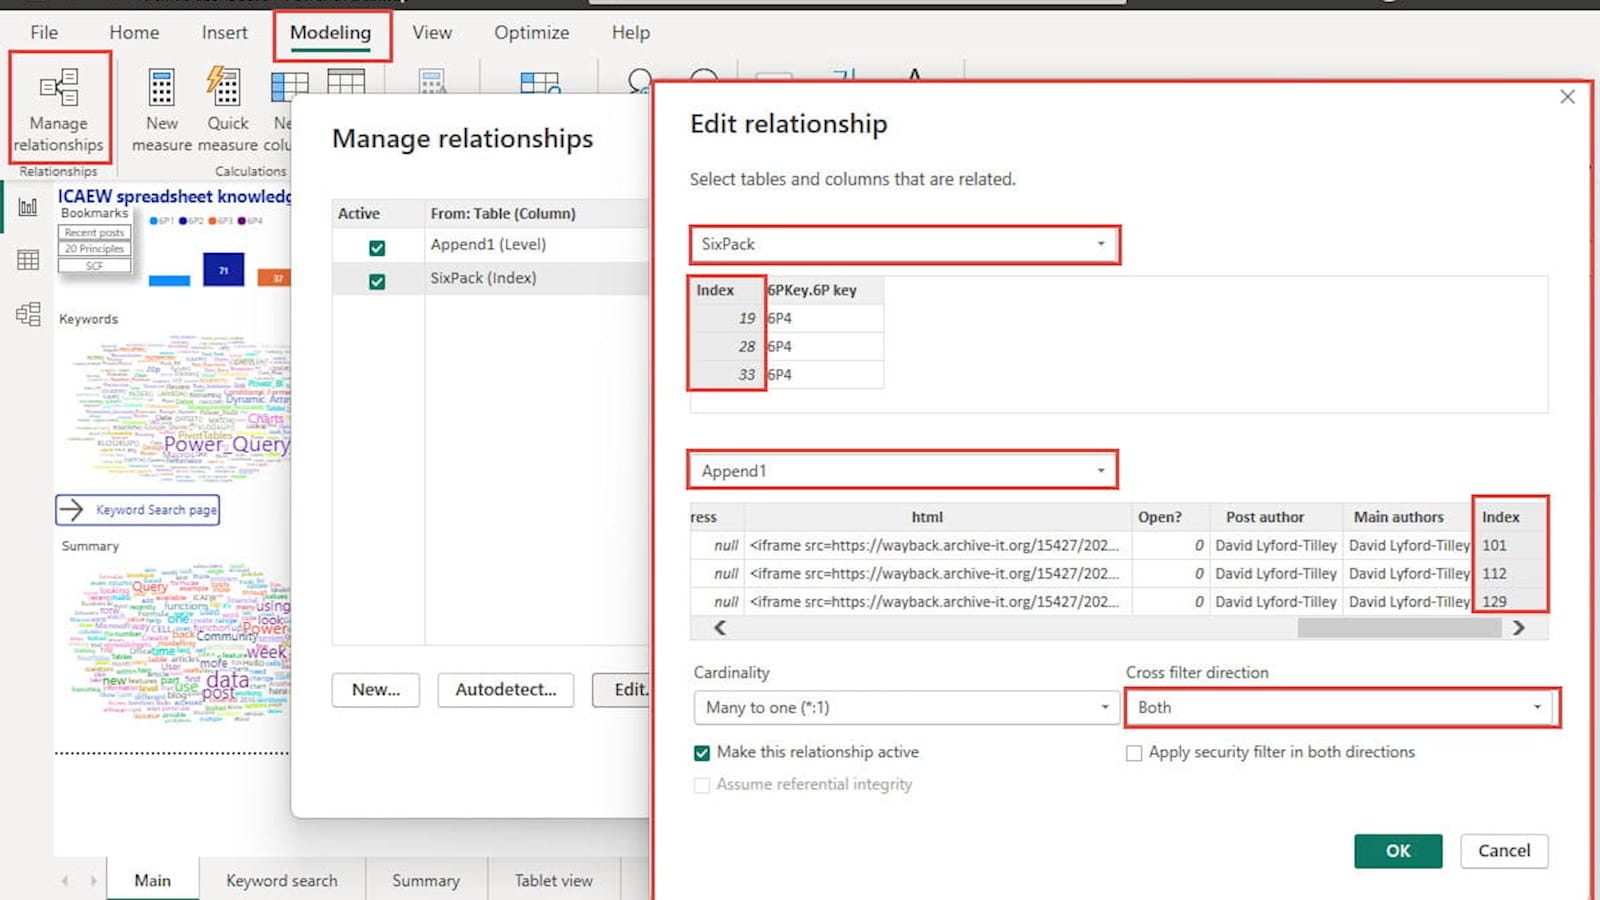
We then need to create the relationship between our new table and our existing articles table. In the Modelling Ribbon tab, Relationships group we click on Manage relationships and create a New relationship that links our match table to our articles table using the Index column in each table. We also set the Cross filter direction to Both:
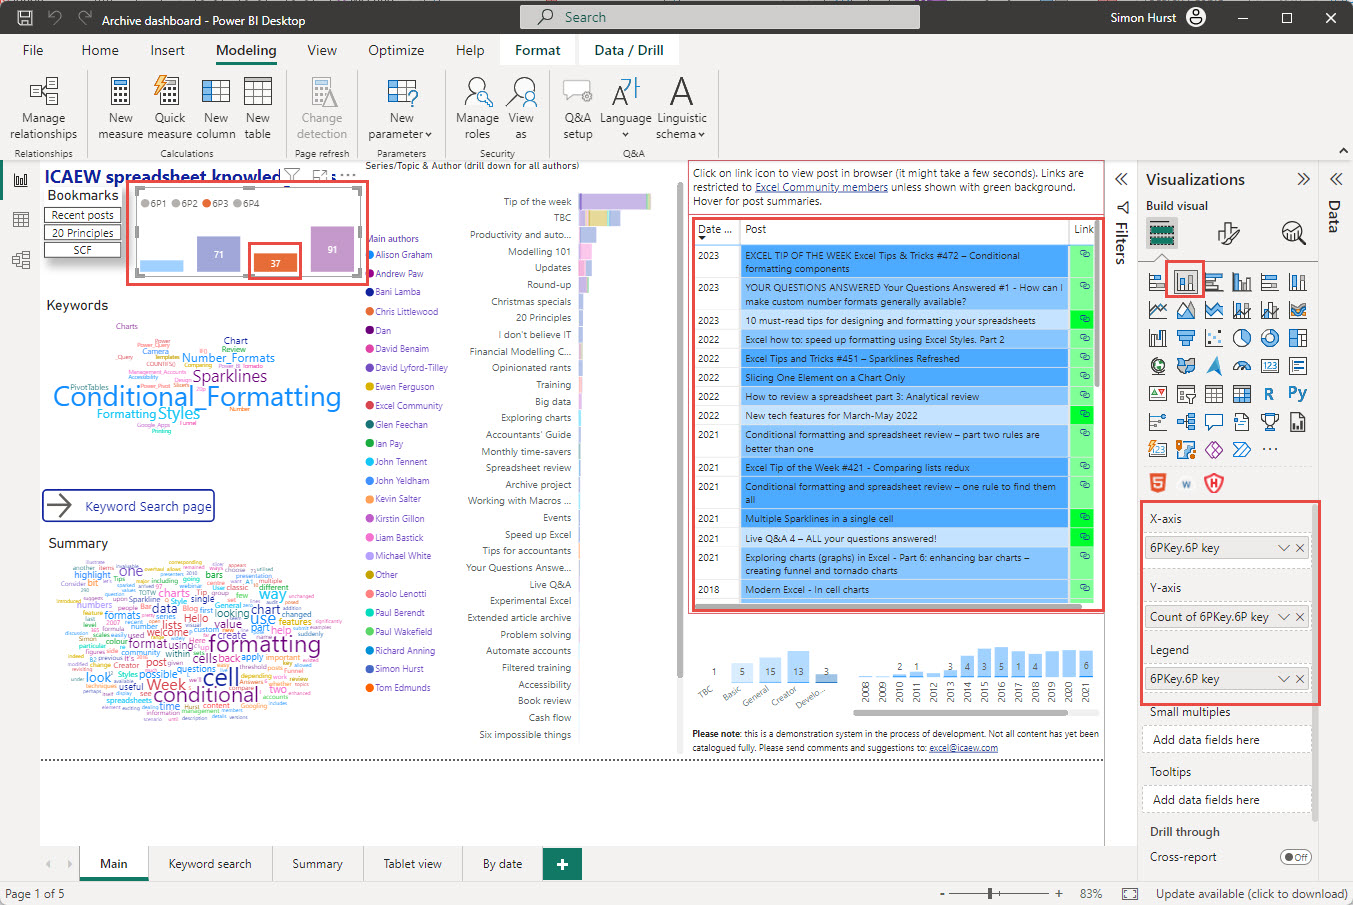
We can now choose a visual to use to apply our filter. We have chosen a simple column chart where each column represents one of our project items and shows how many articles are relevant to the item. Clicking on a column will then filter our list of articles as required:
Conclusion
The new visual is now included on the main page of the archive portal so you can experiment with it.
The 'Open in full-screen mode' icon in the bottom right-hand corner of the embedded report should show the contents at a more readable size with the Escape key returning you to the post.
Archive and Knowledge Base
This archive of Excel Community content from the ION platform will allow you to read the content of the articles but the functionality on the pages is limited. The ION search box, tags and navigation buttons on the archived pages will not work. Pages will load more slowly than a live website. You may be able to follow links to other articles but if this does not work, please return to the archive search. You can also search our Knowledge Base for access to all articles, new and archived, organised by topic.