
In Part 1 of this four-part series, we cover the common requirements in building financial models including illustrating some common repeatable calculations.
One of our regular readers sent me an email the other day saying I don't seem to write as many complex formulae as I used to. Well, be careful what you wish for, dear reader, as I make a return to form this month and then some – with a series of articles on techniques to perform repeatable calculations using dynamic arrays!
A common requirement in building financial models is a repeatable calculation, or more accurately, a repeatable "block" or set of calculations. This might be to calculate forecast revenue for different products, depreciation for different asset classes, debt repayments for different financial instruments or tranches, and so on.
This time out I thought I would demonstrate a technique for repeating such calculations with dynamic arrays. Brace yourselves though – it ain't pretty, but it is pretty effective.
In order to illustrate the approach as clearly as I can, I am going to make the repeatable block simple, so as not to complicate things unnecessarily. With this borne in mind, imagine I have the following collection of inputs:
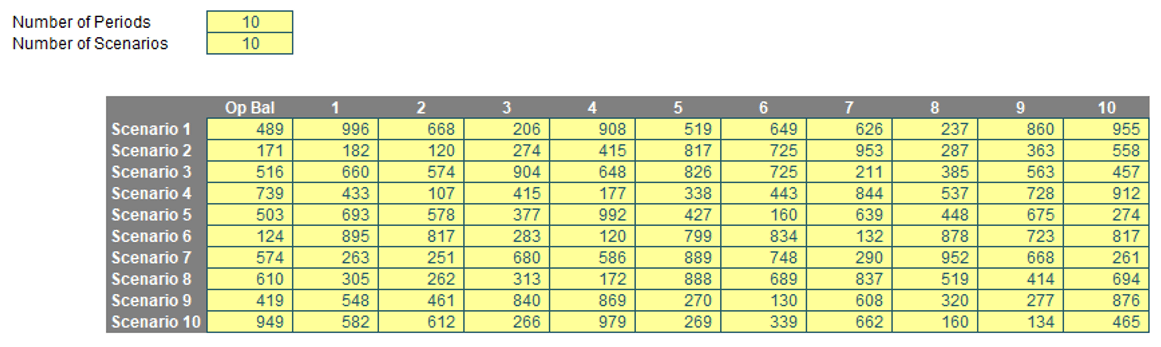
This has been set up so that the number of periods (given the range name Periods) and the number of scenarios (given the range name Scenarios) may vary between one [1] and 10, eg,
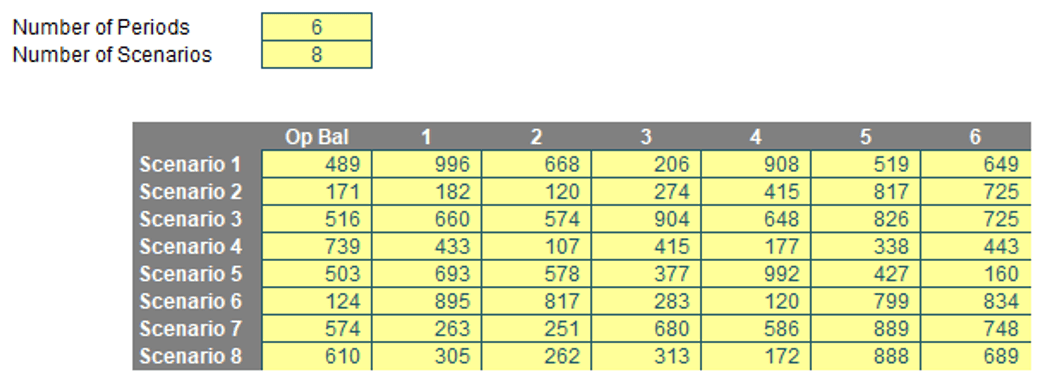
I shall leave the values both set at 10 in further screenshots, but you get the idea.
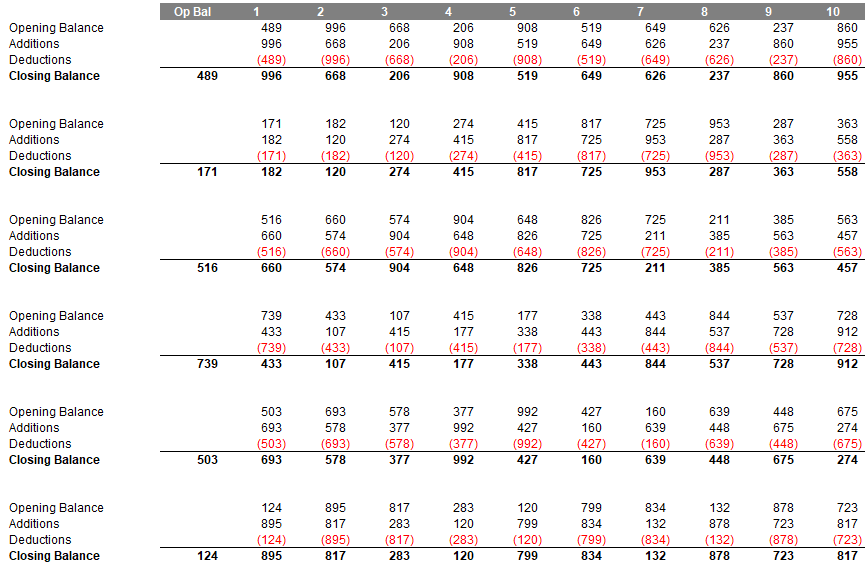
To illustrate my idea, I am going to create a Control Account of this data, assuming the first column represents the opening balances, and the remaining columns state the purchases (say) for the particular scenario and period. Therefore, for Scenario 1, I might have a Control Account that looks like this:
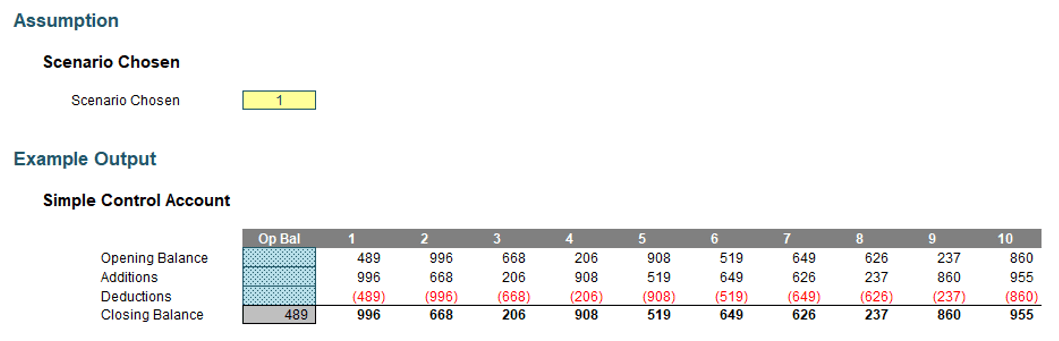
Where the Additions are simply those purchases, the Deductions are based upon the Opening Balance, and the Closing Balance is simply the sum of the above. For Scenario 2, the output might look like this:
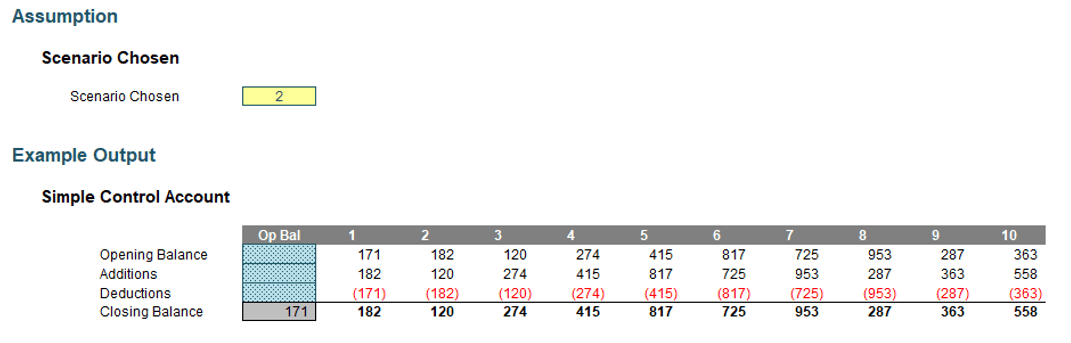
and so on.
This calculation may be achieved with OFFSET, INDEX, SUMIF and so on, but the formula for calculation of a one-off Control Account where the scenario may be changed is not the focus here. No, what I want is to create all the relevant Control Accounts simultaneously, eg,
I understand many of you will have ideas how to create such an output already, but today, I want to construct it using ONE dynamic formula – well, two if you include the labelling! In fact, let's start with the labels as they are simpler.
Our attached Excel file has several key parameters:
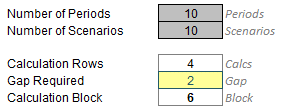
We already know Periods and Scenarios, but three others are required also:
- Calculation Rows: This is the number of rows in the repeatable block. This could be an input value or you could use a function such as COUNTA to count the number of non-blank rows. The cell has been given the range name Calcs.
- Gap Required: This is the number of blank rows to be inserted between computational areas. This would be an input. The cell has been given the range name Gap.
- Calculation Block: This is the number of rows required in each repetition. This would be the total of Calcs + Gap. The cell has been given the range name Block.
Therefore, for 10 scenarios, we would need 10 x (4 calculation rows + 2 blank rows) = 60 rows. This would be mathematically equivalent to
=Scenarios * Block
Furthermore, for each repeated Block, we'd require:
- the first row to display the Opening Balance
- the second row to display the Additions
- the third row to display the Deductions
- the fourth row to display the Closing Balance
- the fifth and sixth rows to be blank
- then the cycle repeats.
Therefore, we could do with having a counter going from 1 to 60 which would highlight the range and another cycling through 1, 2, 3, 4, 5 and 6 a total of 10 times to decide what to put on each row. I feel it's time to use various functions including those used for dynamic arrays…
That's all for this week! In the second article of this four-part article series, we refresh some of the key functions required for repeatable calculations.
Further resources
Archive and Knowledge Base
This archive of Excel Community content from the ION platform will allow you to read the content of the articles but the functionality on the pages is limited. The ION search box, tags and navigation buttons on the archived pages will not work. Pages will load more slowly than a live website. You may be able to follow links to other articles but if this does not work, please return to the archive search. You can also search our Knowledge Base for access to all articles, new and archived, organised by topic.