
In a recent ‘Power Tools Part 2: Harness the potential of Power BI’ webinar, Monica Odysseos explored the fundamentals of Power BI, including loading data and understanding its structure. Monica returns to answer some questions from the webinar she was unable to respond to during the session.
The question
Does Power BI leave the underlying data source unchanged? I want to link to a database but don't want to accidentally amend any of the underlying data.
Answer
Yes, Power BI does not make any changes to the original data source. It connects to the data, like a copy, and uses it for creating reports and dashboards. Your database remains untouched, and there's no risk of accidentally modifying the underlying data. It's a read-only tool, so you can confidently link to your database without worrying about unintended changes.
The question
Is a many-to-many relationship linking table the equivalent of XLOOKUP. How does Power BI deal with anomalies with the relationship?
Answer
A many-to-many relationship linking table in Power BI is similar to using the XLOOKUP function in Excel. It helps connect data from two tables that have a many-to-many relationship. They do, however, serve different purposes.
Many-to-Many Relationship with Linking Table:
In Power BI, it's used when two tables are related. It helps connect records across tables, often for scenarios where multiple items from one table can be associated with multiple items from another.
Allows for proper aggregation and filtering in reports.
XLOOKUP Function:your questions answered #8
XLOOKUP is an Excel function for searching and retrieving values from a range or array.
It's mainly for lookup and retrieval, not for defining relationships between tables.
Handling Anomalies in Power BI Relationships:
Power BI provides options to deal with anomalies or missing data in relationships.
Strategies include setting cross-filter directions (Single or Both) and using DAX functions to control relationship behaviour. Handling anomalies may involve data cleaning, transformation, or validation steps in Power Query before loading data into Power BI.
The question
What if there are a few order IDs in my data that don’t match across when you create a relationship link. What happens then?
Answer
If there are a few order IDs that don't match when you create a relationship in Power BI, it means that there might be missing or unmatched data points between the tables you're trying to link. In such cases:
- Data Integrity Check: Double-check the data in both tables to ensure accuracy and consistency. Verify that the order IDs in one table match those in the other.
- Missing Data Handling: Depending on the significance of the missing order IDs, you can choose to exclude them from your analysis or investigate why they don't match.
- Data Transformation: Consider data transformation techniques to clean or align the data, such as using DAX functions or Power Query to fill in missing IDs or align the datasets.
- Data Quality Improvement: In the long term, work on improving data quality to minimise such issues in future analyses. This might involve data validation processes or better data collection practices.
Addressing unmatched order IDs is essential to ensure the accuracy and completeness of your analysis and visualisations in Power BI.
The question
Does power BI add the order date hierarchy automatically?
Answer
Yes, Power BI typically recognizes date columns as dates automatically and sets up an order date hierarchy by default. However, in cases where data quality issues exist or the date format isn't detected correctly, you can manually set the data type to "Date," and Power BI will create the date hierarchy correctly for your analysis and visualisation needs.
The question
How easy is it for Power BI to be linked with some of the popular ERP systems such as Netsuite and Dynamics or accounting packages like XERO?
Integrating Power BI with popular ERP systems like Netsuite or Dynamics is generally straightforward. Power BI provides connectors and tools to establish these connections, allowing you to import and visualise data from ERP systems effortlessly. However, the ease of integration can depend on factors such as the complexity of your ERP setup, data structure, and your familiarity with both Power BI and the ERP system. In most cases, with the right setup and credentials, you can establish a connection and start using Power BI for in-depth reporting and analysis of ERP data.
Integrating Power BI with popular ERP (Enterprise Resource Planning) systems like Netsuite or Dynamics is generally a well-supported and straightforward process.
Power BI also provides connectors and integration options that allow you to connect to various data sources, including accounting packages like Xero. When you connect Power BI to Xero:
- Data Extraction: You can extract financial data, such as income, expenses, invoices, and transactions, directly from your Xero account into Power BI.
- Data Modelling: Once the data is imported, you can use Power BI's data modelling capabilities to structure and shape the data as needed for your reporting requirements.
- Visualisations: Power BI offers a wide range of visualisation tools and templates to create customised financial reports and dashboards. You can design visualisations that provide insights into your financial performance.
- Scheduled Refresh: You can set up scheduled data refreshes to keep your reports up to date with the latest financial data from Xero.
- Sharing and Collaboration: Share the reports and dashboards you create with others in your organisation. You can collaborate on financial analysis and decision-making using Power BI's sharing features.
- Advanced Analysis: Utilise Power BI's advanced analytics capabilities to perform deeper financial analysis, create forecasts, and gain insights from your financial data.
The integration between Power BI and accounting packages like Xero allows you to transform raw financial data into actionable insights, helping you make informed decisions and track the financial health of your organisation.
The question
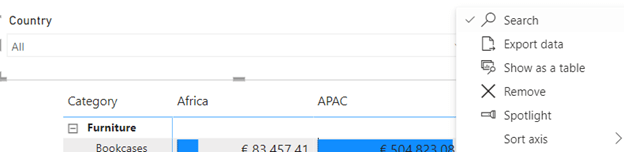
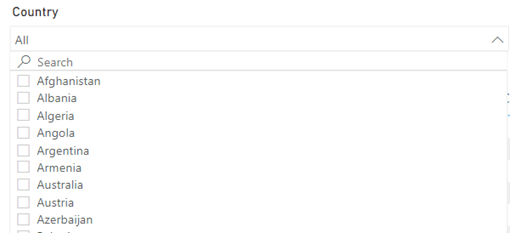
When selecting a field in the slicer is there a search function so that the whole drop-down list does not need to be scrolled through?
Answer
Yes, there is a search function in Power BI slicers that allows you to find and select specific items without scrolling through the entire dropdown list. To use it, click on the three dots (...) on the slicer, and then select "Search." You can then type in the option you're looking for, and it will be selected for you. This feature makes it easier to find and filter data quickly in your reports.
The question
When you create visualisation tabs, can they be shared with someone who doesn't have Power BI for their review?
Answer
Yes, you can share Power BI visualisations and reports with people who don't have Power BI. However, it’s important to note that sharing options will differ depending on the type of license you have. You may need a Power BI Pro or Premium license to share content (see further below).
Power BI offers sharing options such as publishing to the Power BI Service (online) or exporting reports as PDFs. This allows others to view and interact with your reports without needing to have Power BI installed. You have control over the sharing settings, so you can decide who can access and interact with your reports.
To publish Power BI dashboards, you have several options:
Power BI Service (Online):
Share your dashboards directly through the Power BI Service.
Users can access them online via web browsers.
Provides interactive access to reports and dashboards.
Embed in Websites or Apps:
Integrate Power BI reports into your websites or applications.
Users can access the reports seamlessly from your platform.
The question
For the Maps functionality, is there something you need to do to the relevant data column to identify it as countries or does Power BI just know based on the name header? And would you be able to do something similar based on UK cities?
Answer
In Power BI, you typically don't need to do anything special to identify a data column as countries or regions. Power BI often recognizes the data based on the name or header of the column. For example, if your data column is labelled "Country" or contains well-known country names, Power BI will understand that it's country data.
Similarly, you can use the same principle for UK cities or other locations. If your data column is labelled appropriately (e.g., "City"), Power BI can recognize it as city data.
Power BI uses the column name and data values to identify the type of location, making it easy to create maps and visualise data geographically. Ιf Power BI doesn't automatically recognize your data column as a specific geographic location (e.g., countries or cities), there are several steps you can take:
- Data Labelling: Ensure that your data column is appropriately labelled with a recognisable name. For countries, using a column name like "Country" or "Region" helps Power BI understand the data's context.
- Data Values: Make sure that the data values in the column align with the expected geographic location. For example, if you're working with country data, ensure that the names in the column match well-known country names.
- Custom Geographic Data: In some cases, you might have data that doesn't fit standard geographic naming conventions, or you may need to work with more specific geographical boundaries. Power BI allows you to import custom geographic data using formats like GeoJSON or Shapefiles. This gives you the flexibility to define your own geographic regions or boundaries and associate them with your data.
By leveraging custom geographic data, you can enhance your geographical visualisations in Power BI and tailor them to your specific needs, even when the default recognition might not cover your exact data scenario. This flexibility makes Power BI a powerful tool for geospatial analysis and reporting.
The question
What are the major additional functions for a paid version of Power BI?
Answer
In a professional setting, many users start with the free Power BI Desktop version for report creation and analysis. However, for more advanced features and collaboration, organisations often choose a paid version, such as Power BI Pro or Power BI Premium. Here's a brief overview:
Power BI Desktop (Free):
Ideal for individual report creation and analysis.
Offers robust data modelling and visualisation capabilities.
Suitable for smaller-scale or personal projects.
Limited collaboration features; reports can be shared as PBIX files, but not on the web.
Power BI Pro (Paid):
Enables sharing and collaboration on reports through the Power BI Service.
Allows report publishing to the web or within an organisation.
Users without Pro licences can view shared reports.
Supports scheduled data refresh for up-to-date reports.
Offers more storage and sharing options compared to the free version.
Power BI Premium (Paid, Premium Per User, or Premium Gen2):
Designed for larger organisations with extensive reporting needs.
Offers dedicated cloud capacity for faster performance.
Allows for distribution of reports to a broader audience, including external users.
Includes Power BI Report Server for on-premises report hosting.
Supports paginated reports and AI capabilities like AutoML.
Offers enhanced security and governance features.
The choice between these versions depends on factors like the scale of your organisation, collaboration requirements, and the need for advanced features.
The question
Is Power BI available in MacOS?
Answer
Power BI Desktop is not available for Mac. However, Microsoft provides a workaround for Mac users by offering a web-based version called "Power BI Service" that can be accessed through web browsers on macOS. With this, you can view and interact with reports created in Power BI Desktop by others.
- Your Questions Answered #13 - Mastering Copilot in Excel
- Your Questions Answered #12 – Getting started with Office Scripts
- Your Questions Answered #11 – Tips and Tricks Live extended
- Your Questions Answered #10 – Tips and Tricks Live extended
- Your Questions Answered #9 – What is the purpose of # when using dynamic arrays?
Archive and Knowledge Base
This archive of Excel Community content from the ION platform will allow you to read the content of the articles but the functionality on the pages is limited. The ION search box, tags and navigation buttons on the archived pages will not work. Pages will load more slowly than a live website. You may be able to follow links to other articles but if this does not work, please return to the archive search. You can also search our Knowledge Base for access to all articles, new and archived, organised by topic.