
Hello all and welcome back to the Excel Tip of the Week! This week, we have a Creator level post in which we are looking at how to process two particular kinds of data that commonly come out of surveys – whether done in Google Forms, Survey Monkey, or any other kind of surveying software. We are going to look at the formulas and approaches for matrix questions, and for selection boxes.
Matrix questions
A matrix question is one that (in the survey) looks like this:

Most surveying platforms will export the responses data into a spreadsheet format like this:
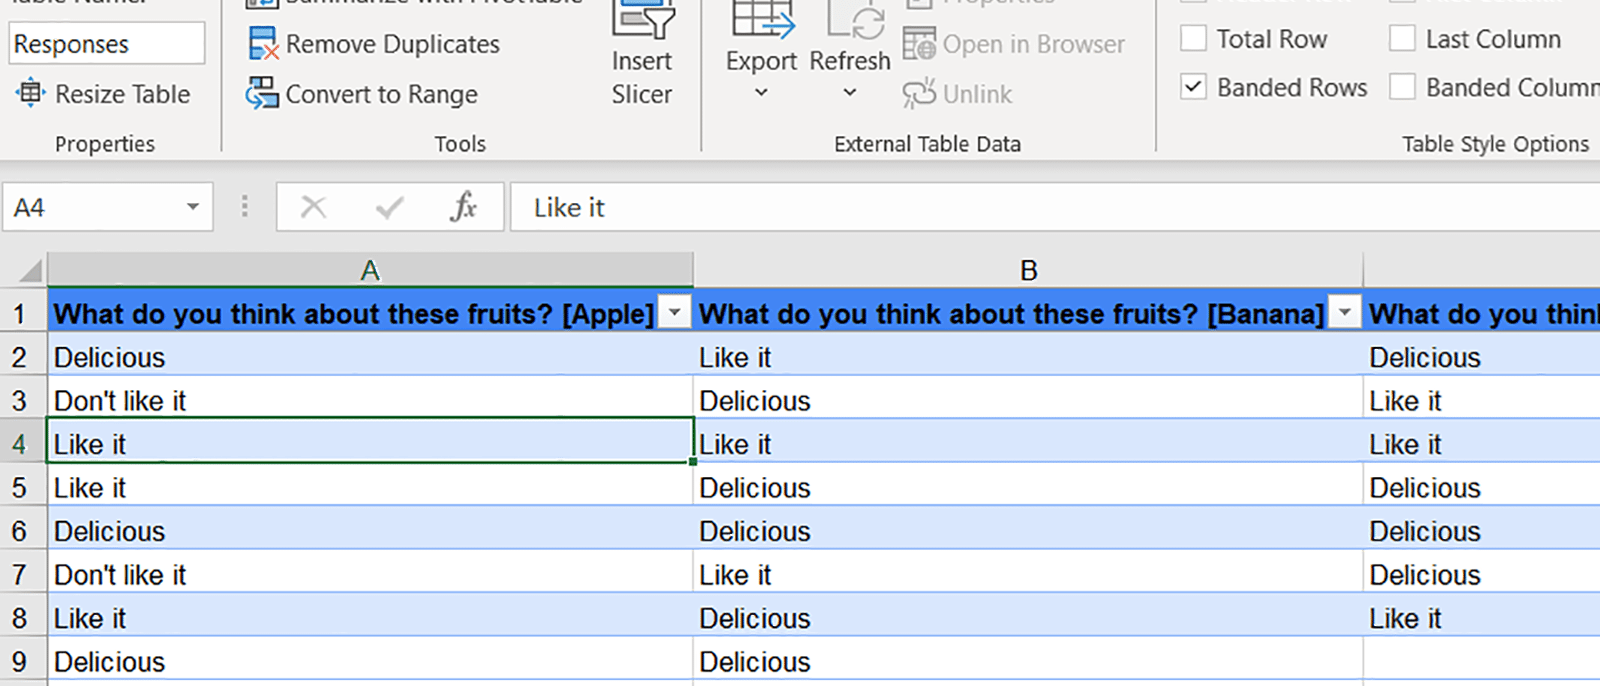
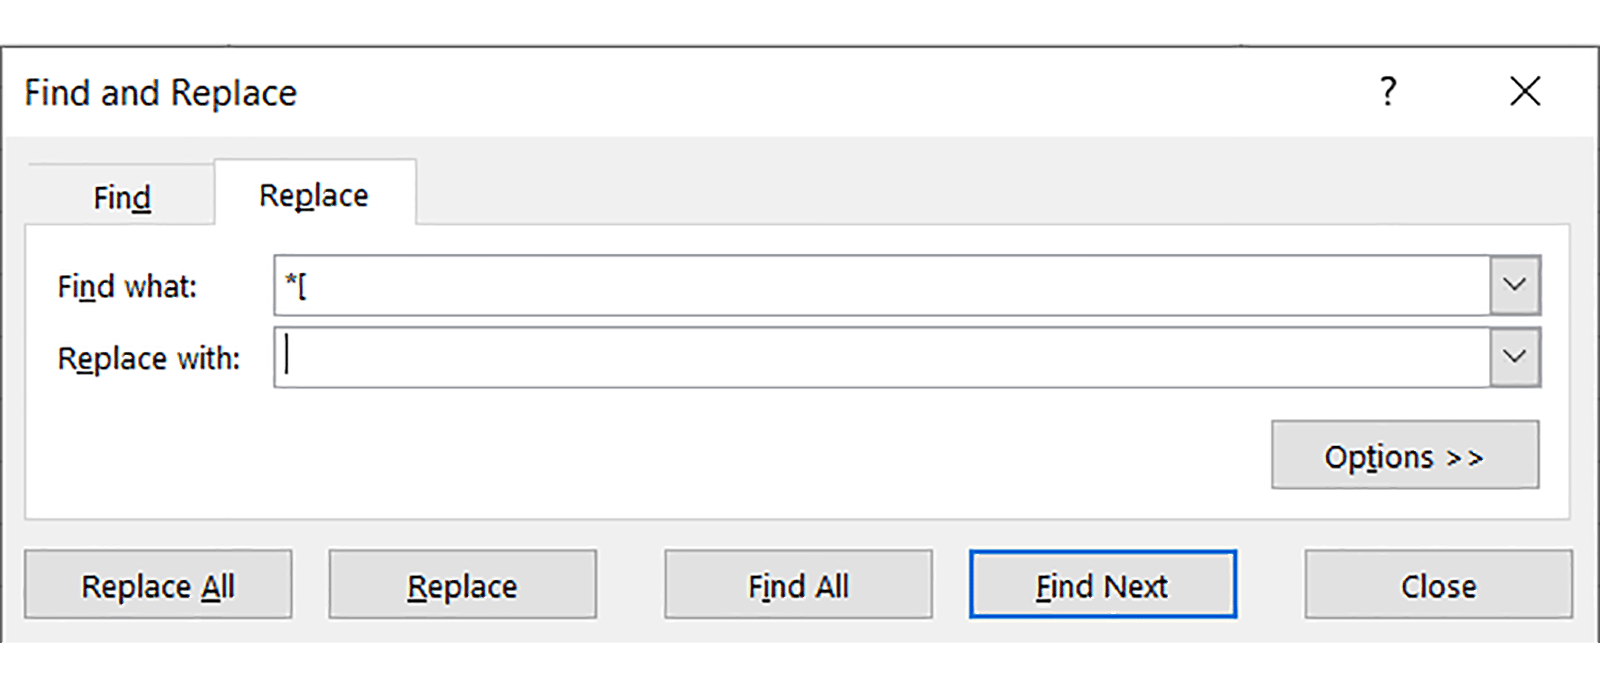
We have a column for each row of the question, and a row for each respondent. The option that respondent chose is typed into a cell. This makes most simple ways of summarising data – like PivotTables – challenging, as our data is spread over multiple columns. But we can work with this! We’ll start by simplifying the column names with a couple of find-replaces to leave the names of each column as just the fruit name:
- Excel Tips and Tricks #506: Creating a single master list after merging data
- Excel Tips and Tricks #505 – 3 ways of converting US Dates into UK formats
- Excel Tips and Tricks #504 - Accessing accessibility checkers for good spreadsheet practice
- Excel Tips and Tricks #503 – Printing under pressure, super quick presentation tips
- Excel Tips and Tricks #502
We can then set up this structure to easily summarise the data:
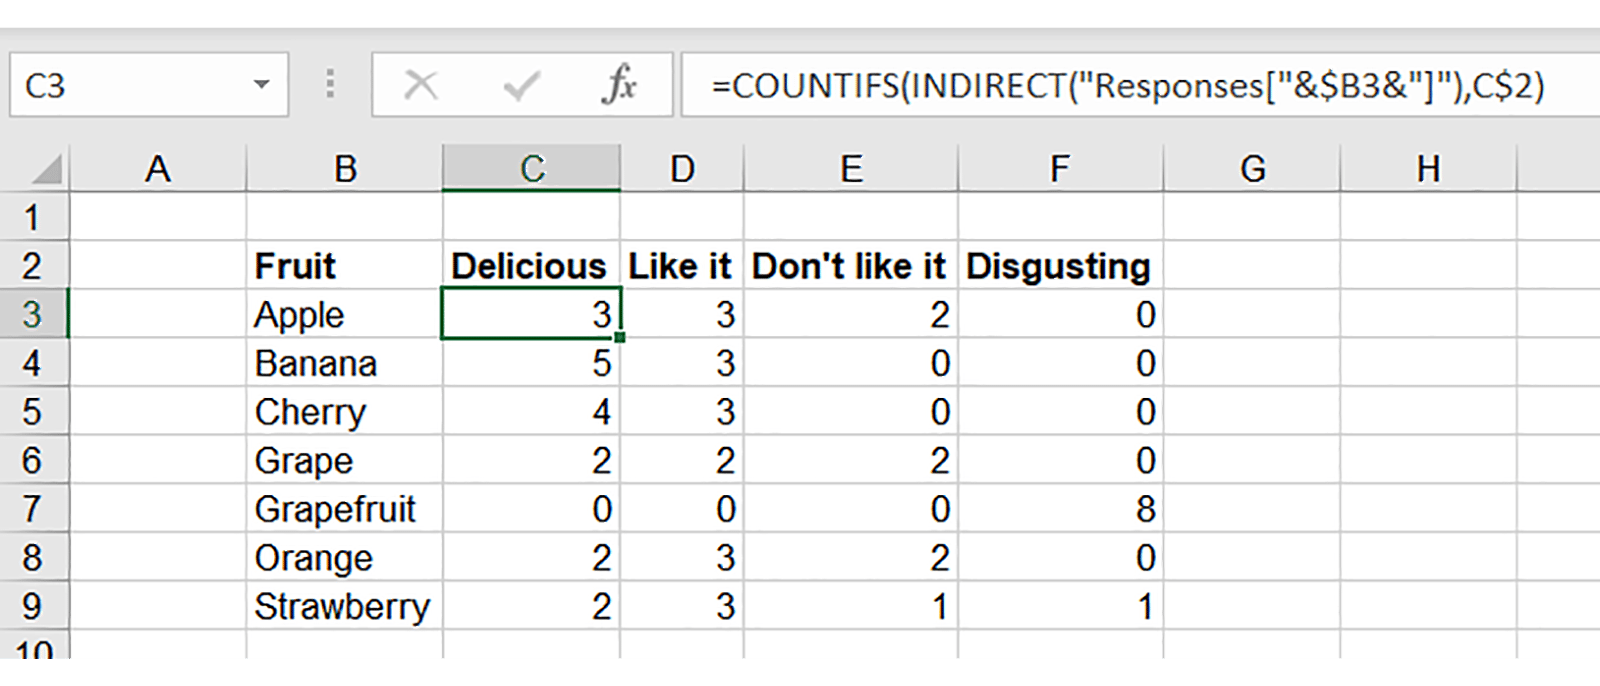
The formula is:
=COUNTIFS(INDIRECT("Responses["&$B3&"]"),C$2)
This formula leverages INDIRECT to identify the correct column of the data using the labels in column B. Essentially we use & to glue together the name of the Table with the responses in it (Responses), a set of square brackets [], and insert the column name from B. We compare this against the options in row 2. With proper fixed references applied by $s, one formula can be copied across the range to complete the process.
This data format also allows us to easily insert a chart to display the answers:
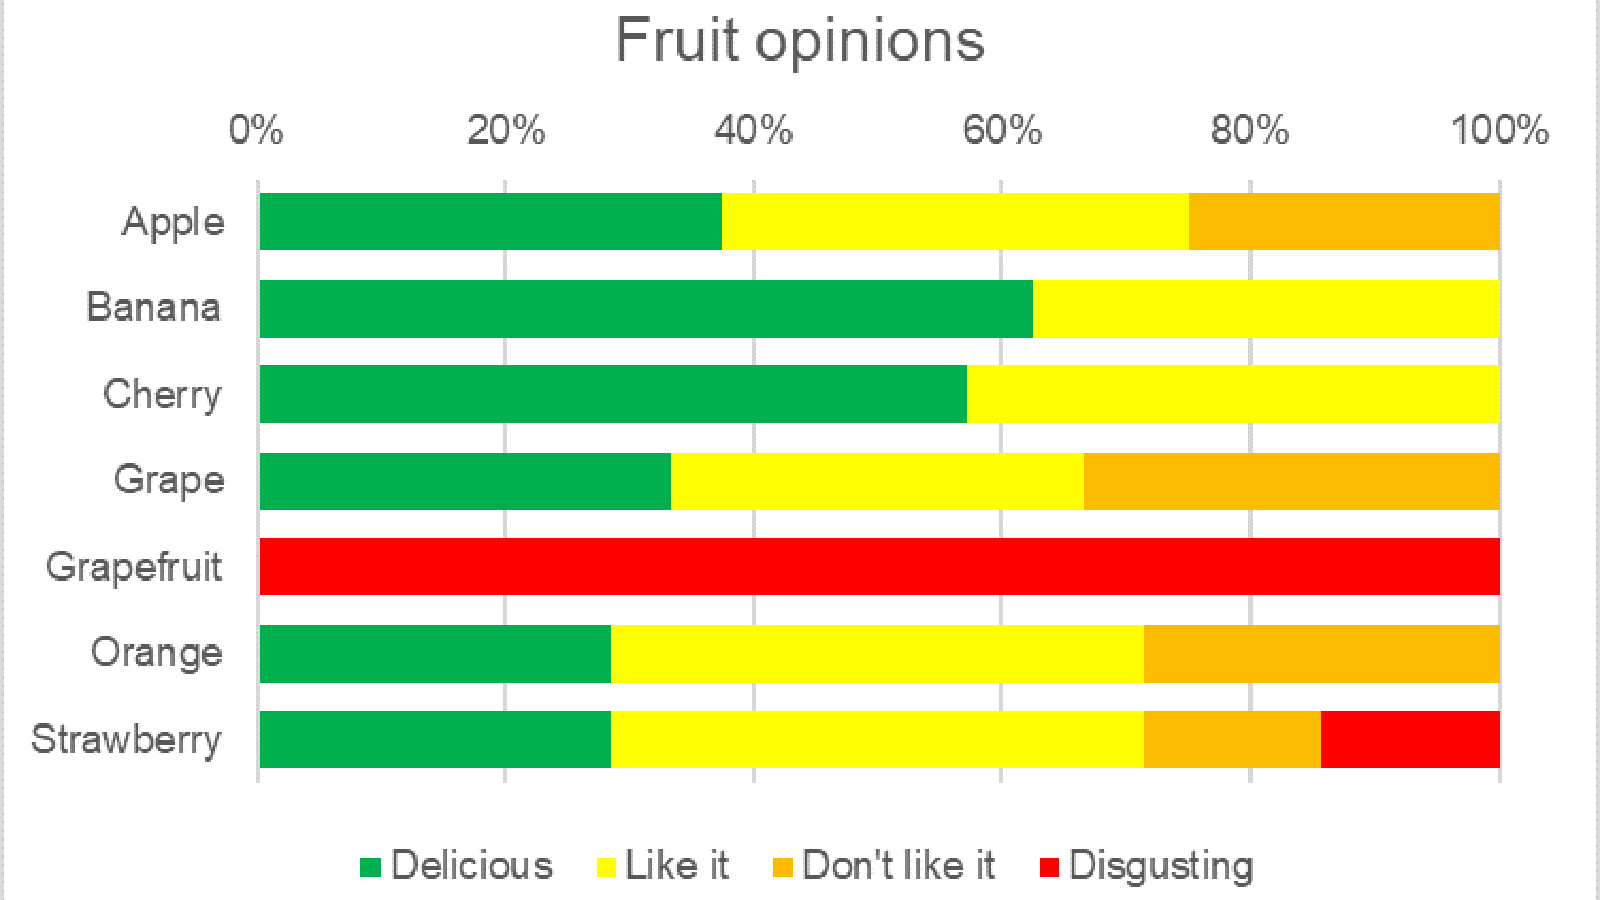
By using Tables and structured references, we can add more responses later on and have the analysis and chart automatically update. Note that we’ve also used a justified bar chart here (that goes up to 100% instead of counting absolute numbers of each response), so that the fact that some respondents skipped questions isn’t reflected in the chart.
You can check out this data, the formulas analysing it, and the chart in this file.
Selection boxes
Our second common question type is selection boxes:
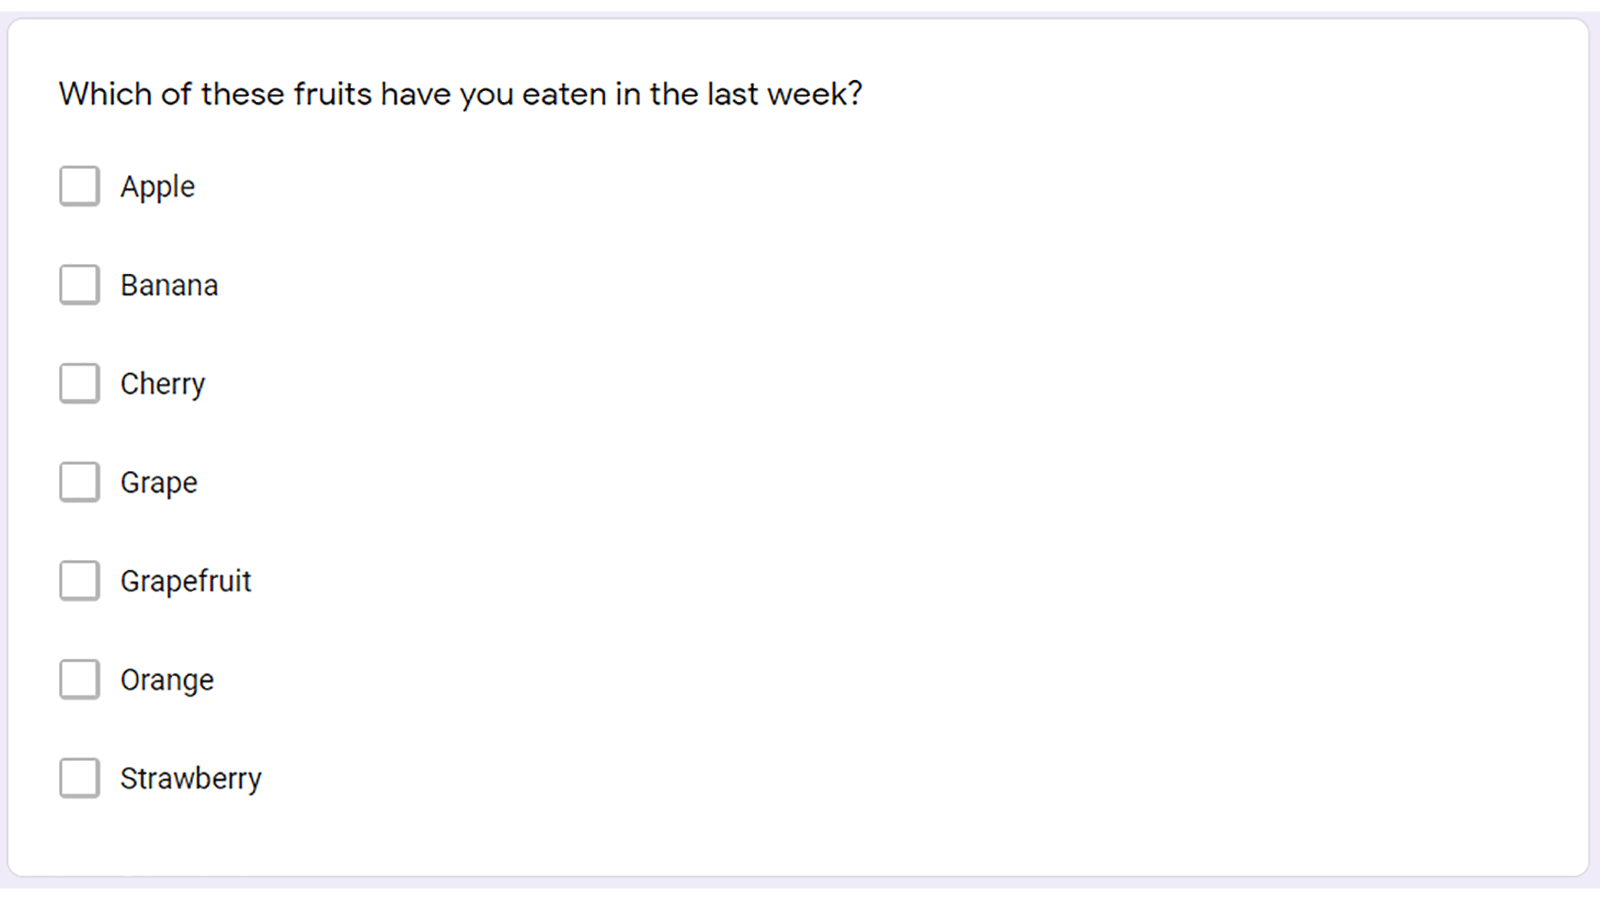
Because multiple responses can be selected, the usual spreadsheet export format is:
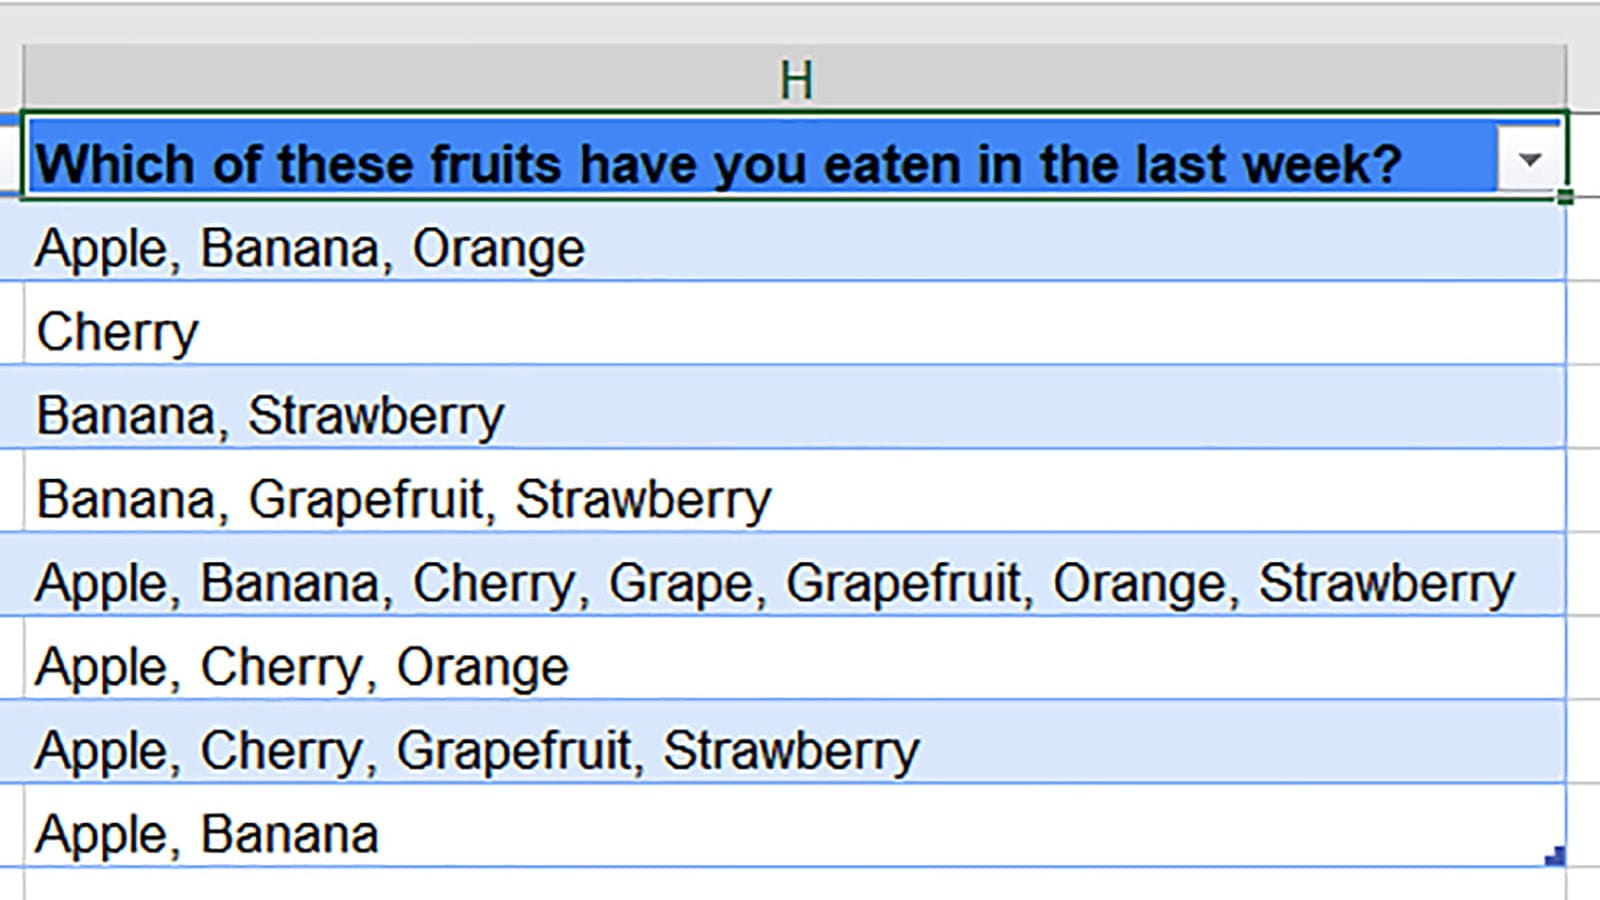
Each respondent gets one row, and any options they picked are listed in a comma-separated list.
We can still use formulas to analyse this data – the secret is to use wildcards. Here’s a look at the breakdown:
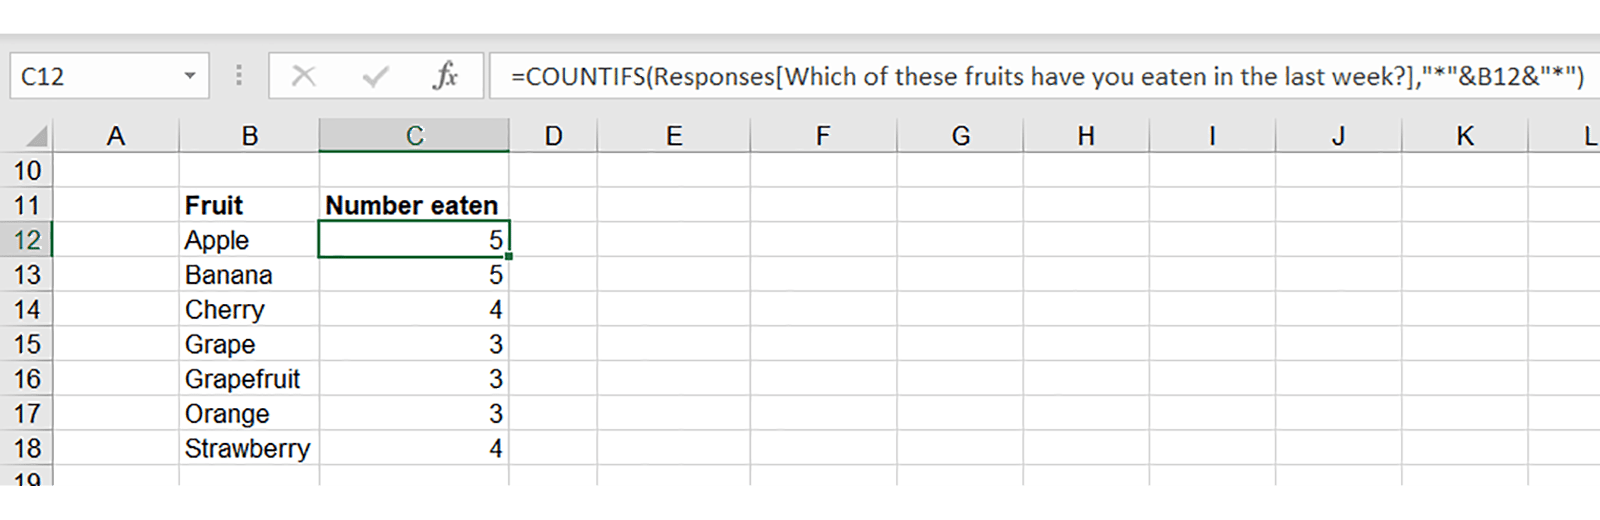
The formula used is:
=COUNTIFS(Responses[Which of these fruits have you eaten in the last week?],"*"&B12&"*")
By appending an asterisk * to either end of the fruit names in column B, we create conditions such as *Apple*. An asterisk wildcard is used in Excel to represent any amount of text – you’ll see we also used this when removing the unneeded text from the responses table in the find-and-replace earlier. This COUNTIFS will count the number of cells where the string “apple” appears anywhere.
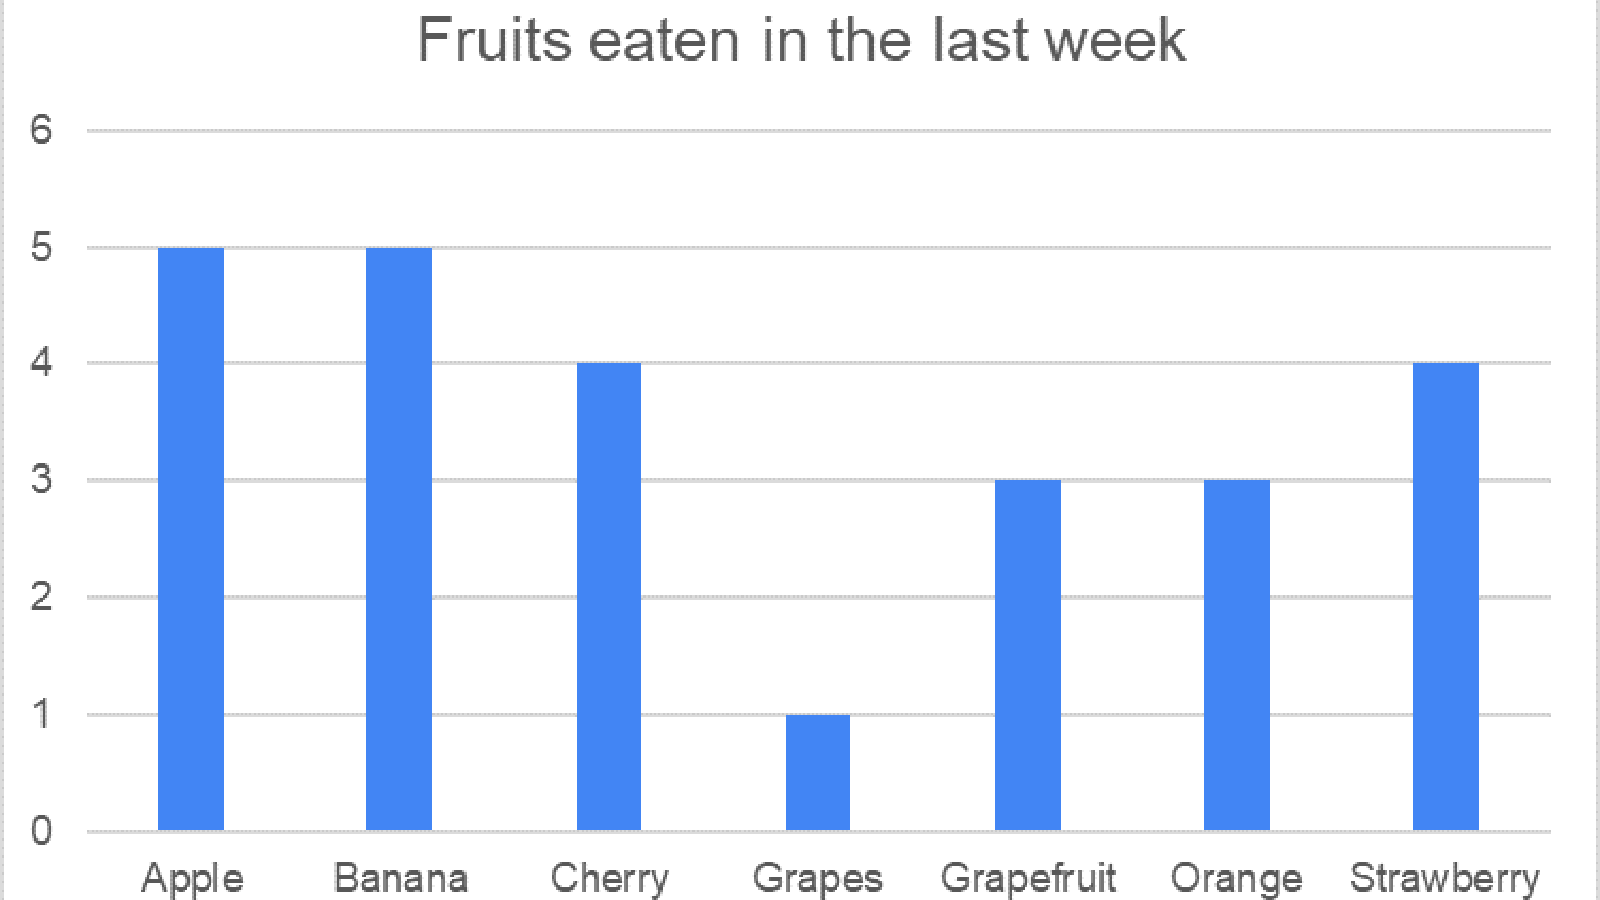
But we have to be careful! Our data covers both grapes and grapefruit – and therefore contains an error. The search *Grape* will match all respondents who ate grapes, but also all those that ate grapefruit. In cases like this, we may need to make more exact formulas, or create a manual formula that excludes the excess matches, or – the simplest solution if it is doable – change the survey form and data wording so that this can’t happen. For example, if we change the option to “grapes”, then we won’t get any false positives.
After doing that we can also make a quick chart:
Once again, you can see all this in the attachment.
You may also like
Excel community
This article is brought to you by the Excel Community where you can find additional extended articles and webinar recordings on a variety of Excel related topics. In addition to live training events, Excel Community members have access to a full suite of online training modules from Excel with Business.

Topics
Archive and Knowledge Base
This archive of Excel Community content from the ION platform will allow you to read the content of the articles but the functionality on the pages is limited. The ION search box, tags and navigation buttons on the archived pages will not work. Pages will load more slowly than a live website. You may be able to follow links to other articles but if this does not work, please return to the archive search. You can also search our Knowledge Base for access to all articles, new and archived, organised by topic.
