
Legacy Excel supports a range of functions and techniques that can help identify potential errors and problems within a spreadsheet as part of a review process. In part 1 of this series we looked at some of the advantages of adding Power Query to your review toolkit and, in parts 2 and 3, explored some of the available tools. In part 4 we are looking at the output of those tools in more detail.
The story so far…
We started in part 1 by using Power Query to quickly reveal some key information about the contents of columns in a table of data. After initially just using the simple bar at the top of each column displayed in the Power Query editor to check for missing values and potential errors, we moved on to displaying a more detailed analysis of column contents using the Column quality, Column distribution and Column profile displays. Part 2 and part 3 used the Power Query Table.Profile function to generate similar information in a table that could be incorporated into our Excel worksheet. In part 4 we will explore this table further.
Errors
In the first part of the series, we saw how the Power Query column information could help us find errors in the underlying data. We are going to start Part 4 by looking at how these errors might, or might not, show up in the profiles table that we created last time.
If a column does contain errors, then all of the Table.Profile() calculations that depend on the values in the column will also return errors and just show as blank in our worksheet table. This doesn't do much to highlight the errors or help us to track down the original values that cause them. However, with our Connections & Queries pane displayed, we can see our Power Query queries themselves and see that our Invoices table reports 8 errors. This error report acts as a live link that we can click on to display the error rows:
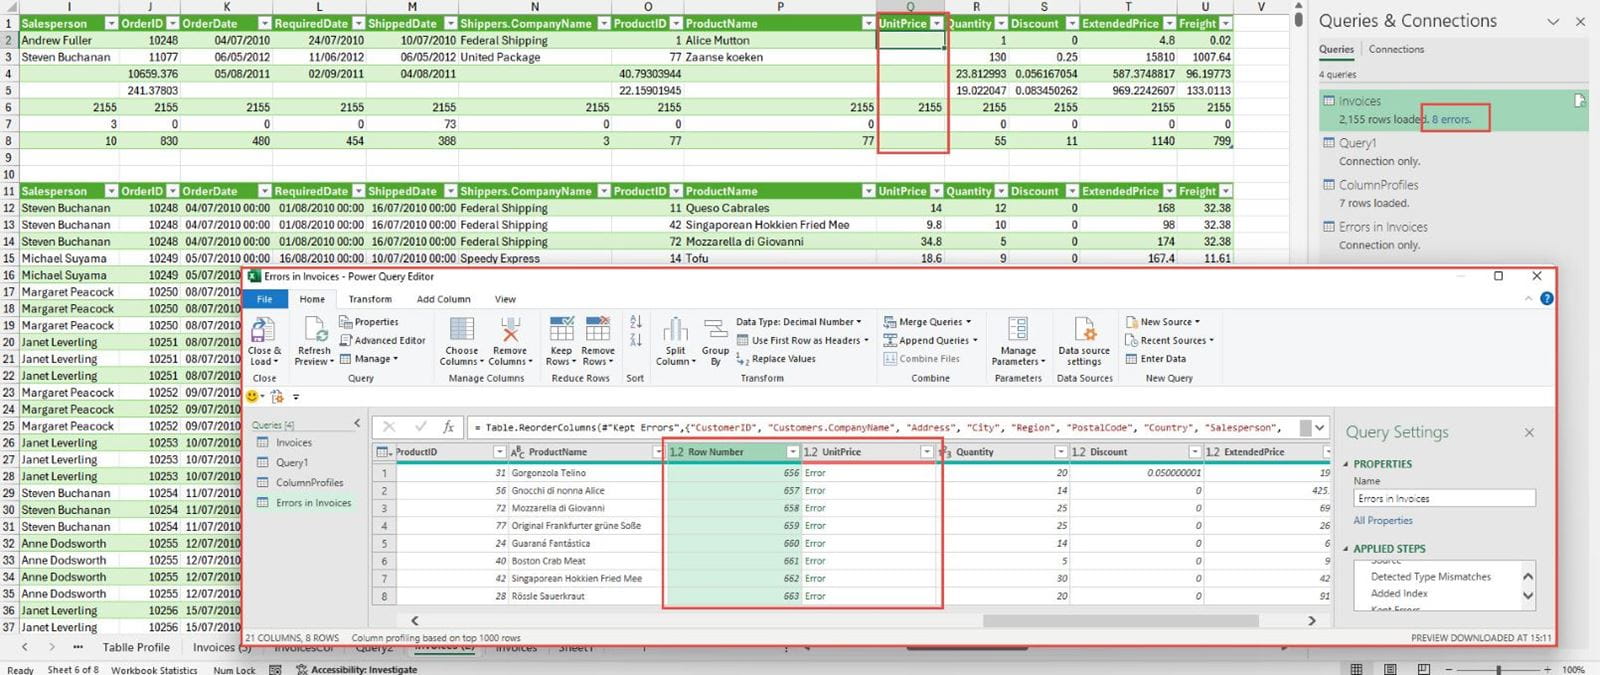
We have moved the Row Number column to be adjacent to our UnitPrice column for demonstration purposes. The error report is created as a query that could be loaded to a worksheet if required. The error report query has a Row Number column added to it. This is the number of the row within the table of data, and not the Excel row number from the original data. Assuming our query doesn't filter or re-sort our data rows, we should be able to calculate the Excel row numbers by just adding the number of rows above the first data row in our worksheet to our Row Number column value.
We also saw in part 1 that certain errors, such as using a comma instead of the decimal point in a number, are treated differently by Excel formulas compared to the equivalent Power Query calculations. In this example, we have built in checks comparing the column totals from our original table of data with totals from the data once processed by Power Query. We have just used simple Excel SUM() formulas that refer to the contents of entire columns in each of the tables:
=SUM(Invoices[UnitPrice])
We have changed our 8 UnitPrice value errors from being text entries to being numbers that include commas where there should be decimal points: for example, 10,20 instead of 10.20
As we can see, these 8 entries cause a difference between our two calculations:
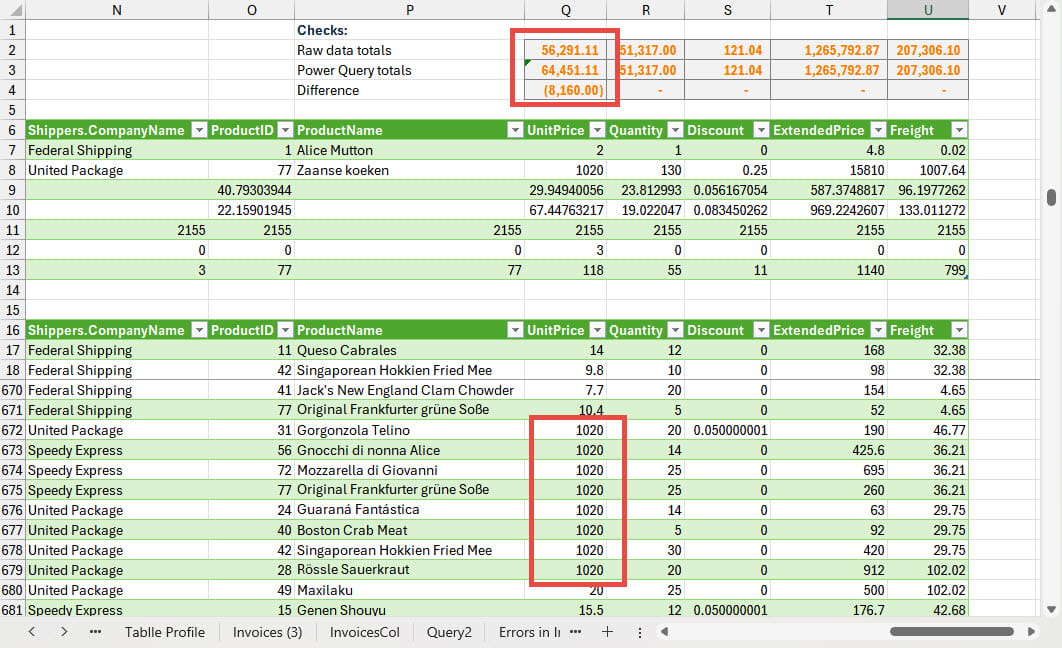
For a simple Excel formula, the comma causes the cell value to be treated as text and consequently to be ignored completely by the SUM() function. In contrast, Power Query attempts to treat the value as a valid number by just ignoring the commas and converting the value to an integer. So, we can see that our difference of 8,160 represents 8 entries of 1,020 in Power Query that are all treated as zero by the Excel SUM() function.
We can see that, in this instance, it takes a combination of Power Query and legacy Excel formulas to highlight and identify our errors.
Conclusion
In future episodes, we will look at some other Power Query features that might help when reviewing a spreadsheet.
You can explore many of the various techniques we have covered here, and a great deal more, in the ICAEW archive.
Archive and Knowledge Base
This archive of Excel Community content from the ION platform will allow you to read the content of the articles but the functionality on the pages is limited. The ION search box, tags and navigation buttons on the archived pages will not work. Pages will load more slowly than a live website. You may be able to follow links to other articles but if this does not work, please return to the archive search. You can also search our Knowledge Base for access to all articles, new and archived, organised by topic.
