
Hello all and welcome back to Excel Tips and Tricks! This week, we have a General User post covering different ways tabular data in Excel can be presented in PowerPoint.
Most users will be familiar with the basic technique of copying and pasting data from one application to another. However, a variety of approaches are available for copying data from Excel to PowerPoint ranging from a simple pictorial representation of the data to a fully embedded Excel file in your PowerPoint presentation. In this article we will consider each of these approaches and why you may want to use each case in your given scenario.
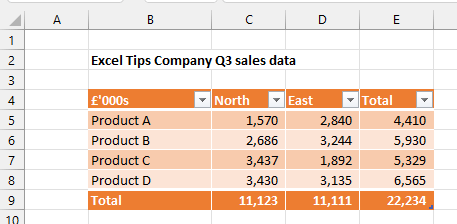
Example data
For demonstration purposes we will use the following quarterly sales data as shown in Excel below.
Copying the data
In all cases the first step will be to copy the data in Excel. We can simply select the range B4 to E9 and choose copy (e.g., press CTRL + C).
Then let’s switch over to PowerPoint and right click in an empty slide to show the available Paste Options.
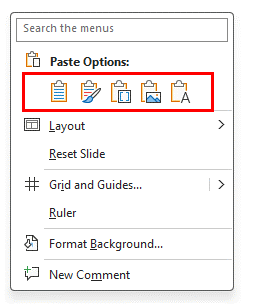
Here we are presented with no less than five different options for pasting Excel data!
Hovering the mouse over each of these icons (from left to right) will show tooltips to reveal their functionality.
Let’s number these options and consider each one in turn.
- Use Destination Styles (the default paste option)
- Keep Source Formatting
- Embed
- Picture
- Keep Text Only
Options 1 and 2: table representation of data
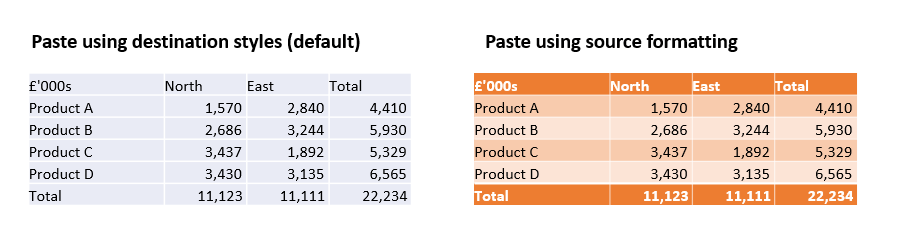
Choosing either of these options will create a table in PowerPoint with a copy of the Excel data. The difference between the two options is how formatting is handled.
The first option “Use Destination Styles” will use your PowerPoint theme to format the data. This is a suitable choice if you want your table to blend in with the existing theme of your presentation.
The second option “Keep Source Formatting” will remain faithful to the original formatting in Excel, as shown below.
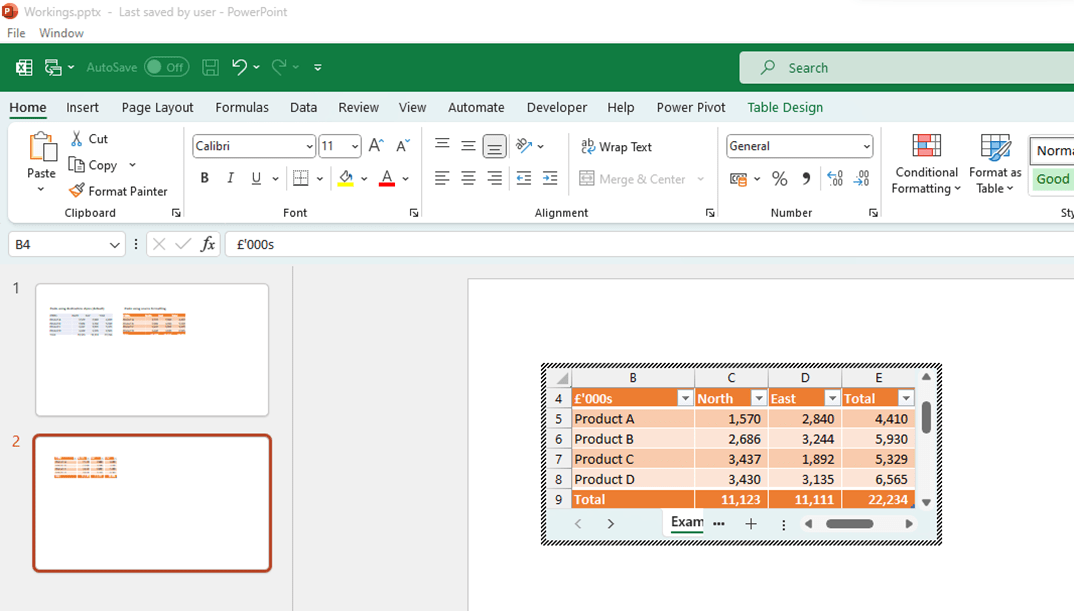
Option 3: Embed
The “Embed” option will create a picture of the copied data. This picture contains a copy of the entire Excel workbook from which the data was copied.
The benefit of this option is that the data can be edited in a full Excel environment for any late changes without needing access to the original file.
To edit the data you can right click on the data that has been inserted to bring up the following menu.
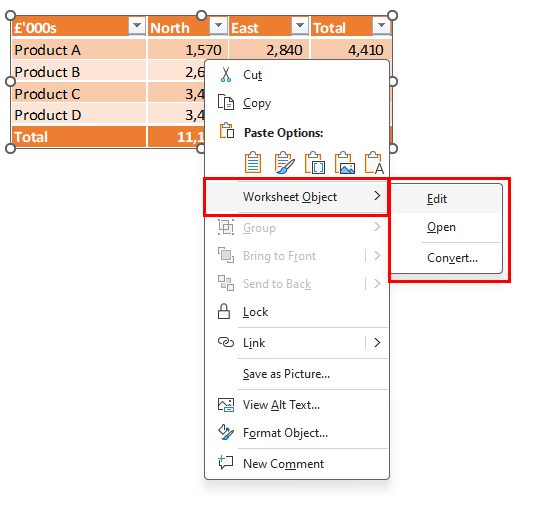
Note that any changes here will not be reflected in the original Excel file as we are working with a copy of the data.
Clicking outside the embedded data will return the interface to normal PowerPoint mode.
If you choose “Open” instead of “Edit” a separate Excel window will open in which to edit the data.
Notice how any changes made to the Excel file are immediately reflected in PowerPoint.
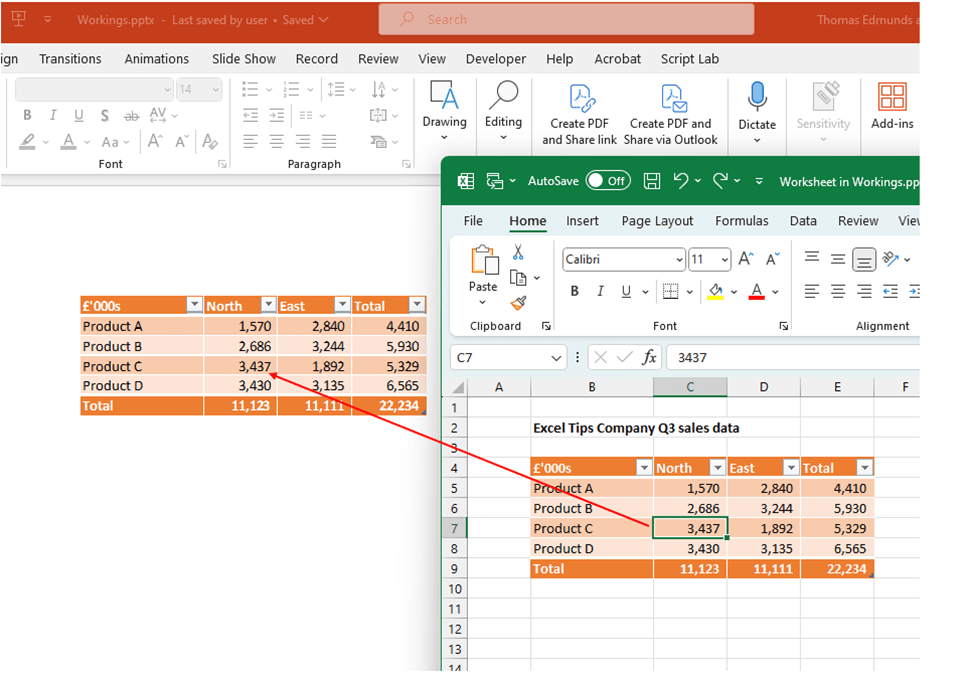
The separate Excel application can be closed once editing is complete and the changes will be saved in the embedded Excel file in PowerPoint.
Word of warning: all data in the original spreadsheet will be copied across when embedding the file in PowerPoint. Be mindful of any sensitive or confidential data before copying the data across! More on how to secure your Excel workbook has been covered in Tip #480.
Option 4: Picture
The fourth option: “Picture” will simply create a picture of the selected range and paste that into PowerPoint. This is great if you do not need to edit the data any further and want to use the usual picture tools to resize or otherwise edit the image.
Option 5: Keep Text Only
The fifth option “Keep Text Only” will create a copy of the data in a text box in PowerPoint, losing all the original formatting. Tab stops are used to separate data on the same row to maintain some of the structure of the original table.
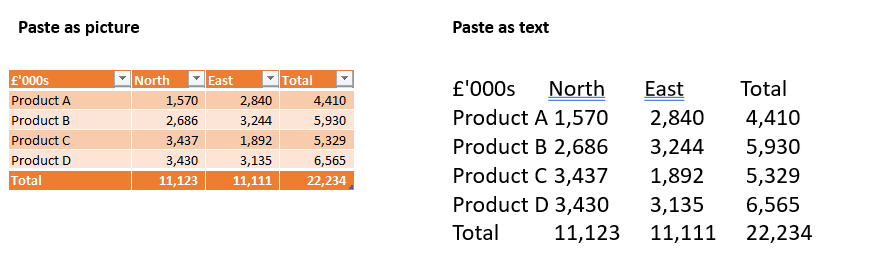
This option removes the constraints of having rows and columns and allows you to edit the data as if it were a single block of text.
Bonus option! – Linking the data
There is also the facility to paste a linked copy of the data. This is very similar to the Embed option above however the link to the source file is not broken, so any changes to the source file will be updated in the PowerPoint presentation.
This option is not available directly from the Paste right click menu but can be accessed by navigating to Paste Special under the Home tab.
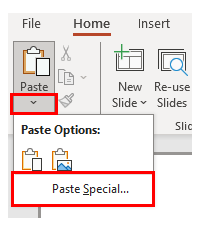
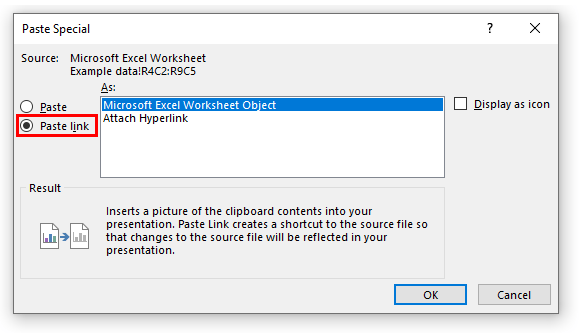
Choosing OK will insert a picture of the data into the presentation in the same way as the Embed option.
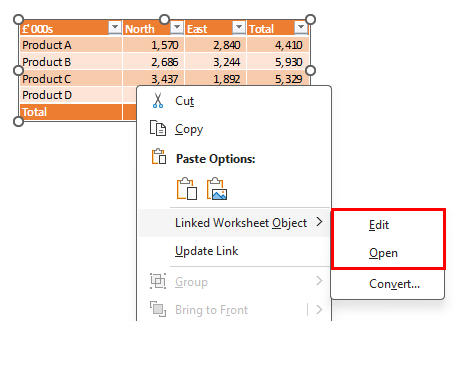
The right click menu looks like the Embed option above except that instead of “Worksheet Object” we have the option “Linked Worksheet Object”. Choosing Edit or Open in this case will open the source file for editing.
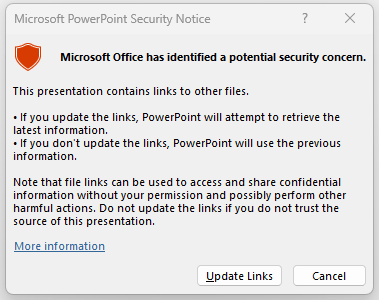
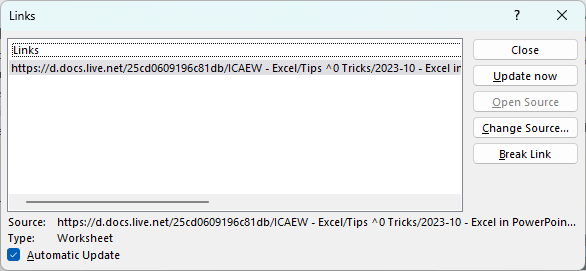
Whether or not the Update Links option is successful will depend on whether the user has access to the source file.
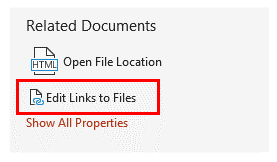
Any Links to external files can be edited by navigating to the Info page under the File menu in PowerPoint. Look in the bottom right corner for the "Edit Links to Files” option.
Visualising Excel data in PowerPoint
In this article we have considered presenting tabular Excel data in PowerPoint. Various options exist for copying charts from Excel to PowerPoint with similar flexibility e.g., choosing source or destination formatting; linking and embedding an Excel chart in PowerPoint or converting to a PowerPoint chart. With so many options available you should hopefully find an approach that meets your requirements!
- Excel Tips and Tricks #506: Creating a single master list after merging data
- Excel Tips and Tricks #505 – 3 ways of converting US Dates into UK formats
- Excel Tips and Tricks #504 - Accessing accessibility checkers for good spreadsheet practice
- Excel Tips and Tricks #503 – Printing under pressure, super quick presentation tips
- Excel Tips and Tricks #502
Archive and Knowledge Base
This archive of Excel Community content from the ION platform will allow you to read the content of the articles but the functionality on the pages is limited. The ION search box, tags and navigation buttons on the archived pages will not work. Pages will load more slowly than a live website. You may be able to follow links to other articles but if this does not work, please return to the archive search. You can also search our Knowledge Base for access to all articles, new and archived, organised by topic.